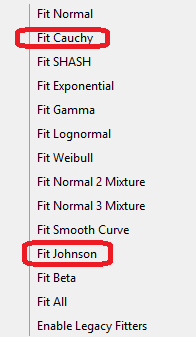
Modernizing the Distribution platform – Options for fitted distributions
JMP 15 has delivered the modernization of the Distribution platform. This post details the new options available for fitted distributions.
See new options for heatmaps, box plots, histograms and more.
In a previous blog post, I showed how to use the Extract Segment feature in Recode to extract a number embedded in a string. Recode also makes it easy to use a regular expression to perform the same task. Depending on the form of the data, it may be easier to use one tool versus the other.
Ever wished for an intuitive and super flexible approach for specifying and fitting models? Structural equation modeling (SEM) is a framework that provides just that! Think factor analysis merged with regression, together with simultaneous estimation of numerous effects and awesome graphs!
Contour plots are a common technique for visualizing functional data. Contours may take on different names for the various functions that they represent -- isotherms for curves of constant temperature, isobars for curves of constant pressure, and many more.
Distribution in JMP has been modernized in the latest version. Learn how to compare fits in Distribution.
Recode has always been a great tool for cleaning up messy data, but it’s also useful for extracting data embedded in text columns. JMP 15 adds the flexible Extract Segment tool, and the platform has been enhanced to generate semantic scripts in many cases so that the script or formula can be executed against new data.
A common question that comes up with Interactive HTML output is "Why is this report just an image?"
We point the cursor at something on our screens, and magic happens. That is the world of tooltips or hover windows.
The Distribution platform is one of the most widely used platforms in JMP. This platform is not only used for testing which distribution fits your data, but it is also used for data exploration, capability analysis, and so much more. This platform has been around since the first version of JMP, and it was time for a modernization. JMP 15 has delivered the modernization of this commonly used platf...
In JMP 15, there's a new feature that's not quite so obvious as the others. But its subtlety belies its power, giving users a renewed confidence in the designs they generate in the custom designer. And it's all thanks to some oft-overlooked research a curious guy found trying to answer a question with a seemingly obvious answer: Can you construct optimal designs for non-standard run sizes?
Help us celebrate 30 years of JMP (and expand your JMP knowledge along the way) with a 30% discount on JMP training and books. Offer good on books Nov. 6 - 13; and training Nov. 6 - Dec 31.
Want to try your hand at automating the publishing of JMP Live reports? Here are 10 efficiency boosting tips to help automate routine publishing tasks. Try these tips on scripts your write for reports and graphs you publish to JMP Public now.
Is your Mac stopping you from installing JMP because Mac OS says it cannot scan it for “malicious code” or it is from an “unidentified developer”? Here is what you can do to install JMP when you get these messages.
dave_matthews1
Is your Mac stopping you from opening JMP because Mac OS says it is from an “unidentified developer”? Here is how to open JMP when you get this message.
dave_matthews1
JMP Interactive HTML can be used either by itself or as part of JMP Live. By itself, Interactive HTML enables users to share reports with dynamic graphs – but JMP Live enables more. Here are the differences between Interactive HTML when used alone and as part of JMP Live in JMP 15. Figure 8. Column Switcher in JMP Live, Exploring Air Quality Data
heman_robinson
The strength of the JMP Pro Functional Data Explorer platform (FDE) is identifying and extracting key features of functional processes for use in further modeling.
JMP Live is a major new product designed to help JMP users share their analyses and collaborate. And here's why we thought it was needed.
日本は、丁度ラグビー日本代表の活躍に熱狂しているところです。現在、ラグビーワールドカップ2019が日本で開催されておりますが、日本は予選リーグで4戦全勝し、初めてベスト8に進むことができました。 そんな中、丁度JMP 15がリリースしました。データ分析家の血が騒いだのは言うまでもありません。予選リーグのデータを集め、いくつかのデータを可視化してみることにしました。 ラグビーでは、トライ、コンバージョン、ペナルティキック、ドロップゴールなどさまざまな方法で点数を取ることができ、時間内に点数を積み上げていき、最後に点数が上回ったチームの勝利になります。そこで、2チームの対戦で、時間ごとにどのように得点を積み上げていったかをJMPを使って可視化してみることにしました。そんな時、JMP 15の新機能が役に立ったのです! 次のグラフは、ウェールズ(WALES)vs フィジー(FIJI)につい...
The Cross Evaluation tool in JMP Genomics allows for the evaluation of potential crosses using genetic markers and scoring code files. A scoring code is a SAS file containing a predictive model which quantifies the effects of numerous markers on a trait of interest. The scoring code files used in this example were created in last week’s post, Cross Evaluation and Progeny Simulation with JMP Genomi...