Turn on suggestions
Auto-suggest helps you quickly narrow down your search results by suggesting possible matches as you type.
- New to JMP? Let the Data Analysis Director guide you through selecting an analysis task, an analysis goal, and a data type. Available now in the JMP Marketplace!
- See how to install JMP Marketplace extensions to customize and enhance JMP.
JMP Wish List
We want to hear your ideas for improving JMP. Share them here.- JMP User Community
- :
- JMP Wish List : Top Ideas
We want to hear your ideas for improving JMP software
We know that you have many valuable ideas on potential new features, or enhancements to existing features. You can use this Wish List to share your ideas, and discuss how to improve JMP, with other users across the globe.
Here's how to participate:
- Search: Please search for an existing idea first before submitting a new idea.
- Kudo & Comment Kudo ideas you like, and comment to add to an idea.
- Subscribe: Follow the status of ideas you like. Refer to status definitions to understand where an idea is in its lifecycle. (You are automatically subscribed to ideas you've submitted or commented on.)
- Submit: Post your new idea using the Suggest an Idea button. Please submit one actionable idea per post rather than a single post with multiple ideas.
We can’t implement everything, so please include the following to help JMP Product Management evaluate your ideas for consideration:
- What inspired this wish list request? Please describe the current issue that needs improvement or the problem to be solved that is not easy or possible right now, with an example use case.
- What is the improvement you would like to see? Please describe the idea for improving JMP. Please include mock-ups, wireframes, screenshots, scripts, other documents or examples from other software that help describe the change you would like to see.
- Why is this idea important? Please describe the value to you and/or other users if the idea is implemented (for example, ease of use, must have,…).
Showing ideas with status New.
Show all ideas
Apparently, we do not have a method to perform the following action. dt:column << Type(Best Guess) This is done when loading a CSV, but seems not accessible via JSL. For more context: https://community.jmp.com/t5/Discussions/How-to-force-a-new-best-guess-a-column-modeling-type-and-data/m-p/397945#M64866
... View more
See more ideas labeled with:
Add functionality to use << Set Focus with different interactive display elements (Text Edit Box, Button, Num Edit Box...) (or create new function <<Set Active or similar). This would help when creating user interfaces to reduce time when using them and remove the need to click around or press tab to get to correct element. With barcode scanners: Similar suggestion has been earlier created based on this Set focus on text edit box , suggestion: Set (next) focus on TextEditBox Easier default selection for modals: Default button selection/highlight in modal window Returning to TextEditBox after pressing button: Set focus of display tree (new window) to text edit box And in my current application I have a window with TextEditBox used to filter out datatables. I would like the TextEditBox be selected when you open the window as now user has to first click the Text Edit Box to get it active (or I would have to create a workaround). These can be handled already with different workarounds but I think it should be added as a functionality directly to JMP.
... View more
See more ideas labeled with:
What inspired this wish list request?
Depending what you are doing in JMP, you sometimes have to unnecessarily move from wide data to tall data due to how column switcher / local data filter work - we cannot "filter" columns currently. This is one of the reasons why I did create Enhanced Sankey Plot (ESP) add-in as it is fairly difficult to quickly add/remove specific columns from graph builder.
What is the improvement you would like to see?
I would like to have new tool? "Column Filter" which would allow me to determine which columns I want to show. This would function basically like Data Filter but for columns.
If I have a situation like this where I have multiple columns in my Y-axis for example
I don't have any easy options to hide or add extra columns. If I want to some of those columns or add new ones, I have to stack the data first and the create a graph with local data filter
This does work great but sometimes this feels very unnecessary step.
Why is this idea important?
This would make the gap between tall/stacked and wide/split data smaller.
... View more
See more ideas labeled with:
What inspired this wish list request?
Writing scripts and finally this post How to supress script dump in log upon closing a chart?
What is the improvement you would like to see?
1. Message / argument to prevent report snapshot from single report
I would like to see a message we can use to prevent a platform from being recorded when it is being closed which we could use when scripting. The message could be something similar as the preference we have
<< Report Snapshot On Close(0)
and of course it should be possible to use this as an argument in JMP Platforms.
2. A function which would change how snapshot behaves in current script
Being able to disable all snapshots created from a script could also be useful. The setting could work in similar manner as Names Default To Here(1); and maybe it could be called something like
Disable Snapshot On Close(1);
Why is this idea important?
When writing and using custom scripts it can get quite annoying when your log is being spammed with report snapshots. This can be already prevented by modifying preferences but I would like to keep preferences as they are as I like that snapshots are saved when I'm using JMP interactively and just prevent these snapshots from my scripts. There is also at least one workaround which works from time to time but this is very clunky to start adding to every report
Names Default To Here(1);
dt = open("$SAMPLE_DATA/Big Class.jmp");
nw = New Window("", gb = dt << Graph Builder(
Variables(X(:weight), Y(:height), Overlay(:sex)),
Elements(Points(X, Y, Legend(9)), Line Of Fit(X, Y, Legend(11)))
));
nw << on close(
gb << close window;
);
... View more
See more ideas labeled with:
What inspired this wish list request? I use more than 2 spec limits per process parameter. What is the improvement you would like to see? Please allow more than one limit per side in spec limits, also option to customize the limit name/label will be much appreciated. Why is this idea important? I would like to see the following options when inserting spec limits: LSL2: xxx Label(optional): xxx LSL1: xxx Label(optional): xxx Target: xxx Label(optional): xxx USL1: xxx Label(optional): xxx USL2: xxx Label(optional): xxx
... View more
See more ideas labeled with:
What inspired this wish list request? I often have a large number of windows that accumulate by the end of the day -- these include data tables and scripts. Many of the tables / scripts are just tests and don't need to be saved, but many are important to save. It would be nice to quickly see which are unsaved when looking at the window list. Here is an example -- the black dot indicates that the two corresponding scripts are unsaved: What is the improvement you would like to see? Have an indicator on the window list for unsaved scripts / data tables (and journals or anything else that makes sense) Why is this idea important? If I simply close JMP and select (Save Individually), I then might have to cancel the save to check if a script has an actual needed change or simply was edited for testing purposes. I then have to close, select "Save Individually" again, and repeat the process. It can take 10 minutes sometimes. It would help greatly if I could see visually which windows are unsaved, the I can simply go through the ones I care about and see if I need to save, then close with a "Save Non".
... View more
See more ideas labeled with:
What inspired this wish list request? Silent installation of JMP using DSC tools like Ansible, Chef, SCCM, GPO, fail with an InstallShield error. While the .iss file is a neat feature, InstallShield installs of JMP will fail using these methods. What is the improvement you would like to see? The ability to silent install JMP repeatedly with DSC tools :D Why is this idea important? IT departments are increasingly using DevOps tools to automate their environments and deployments. Ensuring compatibility with such package managers like Chocolatey or SCCM would be a huge benefit. Using a MSI installer would do that, I believe.
... View more
See more ideas labeled with:
Allow joining two data tables based on not exact matches. I come across situations where I have to be able to join two databases (tables) together based on timestamp which aren't exact matches. This would allow me to do it based on those timestamps. The joins could also be based on string-similarities but I haven't (yet) come across situations where I would need to do that.
Continuous column join should let user to define tolerance and allow using grouping column(s).
Below are some example packages, which can provide some ideas on what type of joins and options would be helpful:
Simpler package could be similar to Pandas - merge_asof .
More complicated join options could be found from R - fuzzyjoin: Join data frames on inexact matching which allows joining based on multiple different matching types (string similarity, regex, numeric values within tolerance)
There are couple of scripts found from JMP Community which can do this (or parts of this), but it would be helpful to have this possibility directly built in JMP:
"Fuzzymerge" - join tables with slightly different timestamps by @klk
Join Nearest Rows - Join tables by using continuous columns and nearest values by @jthi (me)
... View more
See more ideas labeled with:
Add annotation to window list to windows which have been modified or not saved, (prefix or suffix * or (*) for example). It would help user to know if there are modifications done to currently open windows. I would prefer it to be in Preferences, so I could choose which types of windows to apply annotation to (projects, journals, reports, datatables, script windows...).
... View more
See more ideas labeled with:
Hello, I would like to suggest that there is an option for platforms to ignore missing data, similar to how you can ignore excluded data in Control Chart builder. The issue this would solve is that if you un-stack a data set, many times you will have unequal number of data rows for each column you create. Then if you try and graph these columns your graph will have lots of blanks. I get around this now by adding a local data filter and clicking on it which selects all the values and will then hide the missing values. However, this is not an easy exercise to do for large number of variables or when using a column switcher. As an example, before using a filter and unclick show excluded region: and after and example of the data in the table after the split(second column in is the CC shown above): thanks! Steve
... View more
See more ideas labeled with:
Presentation at JMP Discovery Summit Americas 2020 on the JMP Cause and Effect diagram. Some items to add to the wish list for future enhancements of the JMP Cause and Effect platform, or a new platform for "mind mapping".
1. Allow the option to open a closed node. Currently only closes the node and shows the ellipsis that the node is closed. Had to add JMP script to send the << Close(0) and << Close(1) messages. So know HierBox can take both messages, just add option to the right-click menu.
2. Diagram allows text to be rotated left or right. Found no option to rotate the display boxes, such as in the entire hierarchy layout. By allowing text to be rotated and display boxes to be rotated, or the entire hierarchy layout to be rotated, has the appearance of mind maps.
3. Add to the current 3 layouts: fishbone, hierarchy, nested, a new layout called something like "mind map" or "flexible map". Use the other JSL objects such as Outline Box, which allows the "node" to collapse or open, to be added to the new layout "mind map".
4. If too difficult to add to the Cause and Effect platform, maybe a new platform that would allow mind mapping. Or an enhanced journal with capabilities. Can be simple, but use the built in JMP display boxes and messages. Could see someone enter Outline Boxes, Text Boxes, but allow connectors like in the Hierarchy boxes, the Cause and Effect Diagram hierarchy layout. It might be that most of the pieces are there in JSL, but just need to be put together to allow mind maps.
... View more
See more ideas labeled with:
It is important to distinguish between a zero value and a missing value. However, if you label a bar chart in Graph Builder with values and the value is zero, then the label does not display. The reader of the chart no longer knows if it was a recorded zero or a missing value. There seems to be no way to force the 0 label onto the chart. Trying to make the value non-zero (i.e. 0.00001) just makes the label show the value - you cannot change the numeric detail of the label (which is a problem already noted: https://community.jmp.com/t5/Discussions/How-to-change-number-of-decimal-places-in-Bar-chart-labels-Label/m-p/213673#M42741) A solution already shown for zero values ( https://community.jmp.com/t5/Discussions/Show-zero-percent-in-bar-chart/m-p/208592) seems to only work for percentages, which my dataset does not have.
... View more
See more ideas labeled with:
In the data table I will have 20 columns and 50 rows. Column 12 row 36 has data I have collected that is suspect. I would like to exclude the individual data point without excluding the entire row or column. Perhaps treating the cell as a blank cell without having to delete the data point.
It would be nice if there was a graph option during the right click on a data point to exclude row or exclude individual data point. Also a right click on the data table cell option to exclude cell.
It would also be nice to be able to include a comment for the individual cell that is attached to the cell by right clicking the mouse.
... View more
See more ideas labeled with:
What inspired this wish list request? I have recently been fitting Mechanistic Growth models in the Fit Curve platform. While confidence intervals for the fit are visible in the Prediction Profiler, there is no way to save those formulas to the table. I can only visualize the results for one batch at a time, and there seems to be no ability to generate or visualize the confidence curves for the individuals at all.
What is the improvement you would like to see? I would like the ability to save the "Mean Confidence Limit Formula" and "Indiv Confidence Limit Formula" out of the Fit Curve platform for any models where it is mathematically possible. (I used the same nomenclature as what is present in the Fit Model>>Save Columns menu, but it seems to vary by platform.) Ultimately, I would like to be able to overlay confidence curves - both for the fit and the individual points - similar to what can be accomplished in the Fit Y By X platform. I could create a visualizations like these in Graph Builder if I could save the formulas for the confidence curves for both the fit and the individuals out to the table.
Why is this idea important?
It enables users to visually communicate the uncertainty associated with models and compare performance between categorical factors.
... View more
See more ideas labeled with:
What inspired this wish list request? I use the cross-hair tool and measurement tools a lot but find myself having to write down a lot of information I gain from them, which is a waste of time. What is the improvement you would like to see? I would like to see the following: Cross hair Ability to "Pin" the cross-hair tool image Ability to save out the values of the cross hair to a table Measurement tool Ability for the cross hairs to calculate a slope value that would show under the dx and dy values Ability to force the measurement tool to stick in an "x / y" mode (like when the axis are different data types) vs the "slope" mode (when data are the same data types). This will allow you to line up the X and Y values to the data more easily. Ability to "Pin" the measurement tool image Ability to save out the values of the cross hair to a table Why is this idea important? The cross-hair and measurement tools are amazing at allowing you to interact with your data but the usefulness is muted by having to resort to hand calculating / documenting the information that you gain.
... View more
See more ideas labeled with:
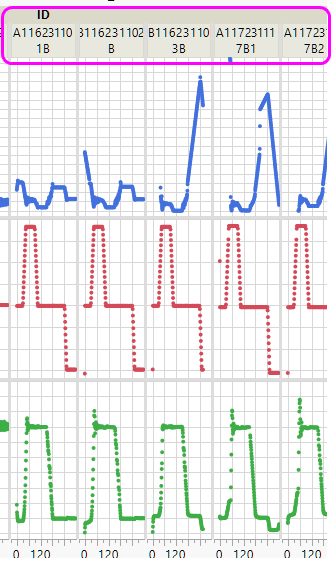
What inspired this wish list request? Please describe the current issue that needs improvement or the problem to be solved that is not easy or possible right now, with an example use case. I am using JMP 17.1.0 on Windows 10. This is a piece of the jsl, the remainder is just axis formatting instructions. In this case the Group X variable = "ID" is a text string that is at least 10 characters long, and with this many IDs to compare, the space is too small to easily read the ID with horizontal orientation. Graph Builder(
Size( 1377, 605 ),
Graph Spacing( 3 ),
Variables(
X( :ProcTime_mins ),
Y( :BVO ),
Y( :TotalAr ),
Y( :VAC ),
Group X( :ID )
), ... What is the improvement you would like to see? Please describe the idea for improving JMP. Please include mock-ups, wireframes, screenshots, scripts, other documents or examples from other software that help describe the change you would like to see. Add an option to change the orientation of the Group X Label to either vertical or horizontal, and the need arises. Why is this idea important? Please describe the value to you and/or other users if the idea is implemented (for example, ease of use, must have,…). I have seen this same question with several solutions in the Community Discussion section but they have not solved the problem. Vertical orientation of the Group X labels would make the ID much easier to read.
... View more
See more ideas labeled with:
Many tables I work with in Query Builder have many field names. Sometimes I have an existing query and want to add a few additional fields. The search field might not help if the field name is abbreviated differently than I expected. The visual of italics when a field is already in the list helps some, but it is hard to turn my brain on/off as I scroll through the list to find the non-italicized field name I'm looking for. It would be very helpful to have a filter on the search field at the left of query builder to only show the fields NOT already used in the main query build (not selected). It should work with the filter you already have for highlighting one table and only seeing the fields for that table. This is an "ease of use" idea. I can get around it, but it is frustrating because it seems like it could be a relatively easy filter to add. I asked if there was an option to do this at the JMP training at my company, and they thought it was a very useful idea that was not currently available and suggested I enter it here. Example: In the image below, a filter for "Fields not in Query" would show just Order_Type and Customer as those are the only fields not in italics (not in the query). I assume it would be accessed from the red triangle.
... View more
See more ideas labeled with:
What inspired this wish list request? I often find myself with new data tables that are almost identical to old ones. I need to pull the plotting scripts from the old tables into the new ones. What is the improvement you would like to see? When I drag a script from the top-left pane of a data table window to another window, it looks like it's accepting it, but then nothing happens. I would like to be able to copy a bunch of scripts from one data table into another via drag-and-drop. Why is this idea important? The script drag-and-drop is an intuitive action that seems to work, and it's frustrating that it doesn't. (JMP v17, Windows and Mac)
... View more
See more ideas labeled with:
What inspired this wish list request? Desire to expand functionality of line fitting in Graph Builder plots. What is the improvement you would like to see? When fitting a line in Graph Builder, allow the user to force the Y-intercept to zero. This functionality is available in Fit Y by X (through Fit Special) but not Graph Builder. I have had multiple internal users ask me how to do this, or whether it can be added in the future. Why is this idea important? Allows users access to functionality found in another platform from the popular Graph Builder platform.
... View more
See more ideas labeled with:
What inspired this wish list request? This post Referencing a table that is created via "make into data table" where user is creating complicated Workflow and tries to get values from report tables (when JMP creates tables from report table boxes they will get named "Untitled automatically.)
What is the improvement you would like to see? When user uses Make Into Data Table or Make Combined Data Table let them choose the name of resulting table.
Why is this idea important? Improves JMP's capability to provide robust scripts to user (easier for non-scripter people to create automatisations with enhanced log and workflow builder).
... View more
See more ideas labeled with:
Idea Statuses
- New 643
- Needs Info 52
- Acknowledged 726
- Under Consideration 19
- Yes, Stay Tuned! 25
- Delivered 258
- © 2026 JMP Statistical Discovery LLC. All Rights Reserved.
- Terms of Use
- Privacy Statement
- Contact Us