Laney P’ and U’ Charts
Have you ever created a P or U Control chart with large subgroup sizes? Were your limits so narrow that an unexpected number of points were flagged as beyond the control limits? P and U charts are based on assumptions such as the underlying distribution (binomial and Poisson) and the average of the distribution being the same over time. These assumptions do not always hold. Your data may show over...
 tonya_mauldin
2077 views
|
0 replies


 LandraRobertson


 Ritalv
 jordanwalters
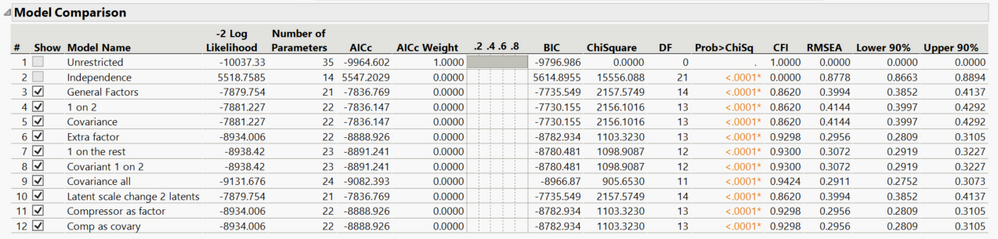


 MikeD_Anderson


 ben_ph
 gail_massari
 Meg_Hermes
 monica_beals
