- Due to inclement weather, JMP support response times may be slower than usual during the week of January 26.
To submit a request for support, please send email to support@jmp.com.
We appreciate your patience at this time. - Register to see how to import and prepare Excel data on Jan. 30 from 2 to 3 p.m. ET.
JMPer Cable
A technical blog for JMP users of all levels, full of how-to's, tips and tricks, and detailed information on JMP features- JMP User Community
- :
- Blogs
- :
- JMPer Cable
- :
- The (other) 5th thing I wish I knew when I started scripting: How to package thi...
- Subscribe to RSS Feed
- Mark as New
- Mark as Read
- Bookmark
- Subscribe
- Printer Friendly Page
- Report Inappropriate Content
 You've created a script. Now how can you share what you’ve created?
Welcome back! If you’ve made it this far, you’ve probably got a working script of some sort. Congrats! If you’ve just discovered this series, you might want to put a pin in this article and start from the beginning.
Here are links to the ones you may have missed:
- The 1st thing I wish I knew when I started scripting: There are different kinds of scripts
- The 2nd thing I wish I knew when I started scripting: Getting help
- The 3rd thing I wish I knew when I started scripting: The Answer Button is your friend
- The 4th thing I wish I knew when I started scripting: What to do when things go wrong
- The 5th thing I wish I knew when I started scripting: How to string things together
- The new thing I'm going to show people when they start scripting: The Enhanced Log
So, you’ve got a nice new bit of code. What are your plans for it? If you’ve gone to the trouble of creating a script, you should probably consider how to package it for others (or yourself) to easily use. In this last entry, I want to give you some ideas about how to share what you’ve created. JMP has several options depending on how you want to share it.
Sharing your work
There are four or five methods (depending on who you talk to) for packaging scripts for others to consume: JSL files, Query Builder files, JMP add-ins, JMP applications, and JMP Live and/or JMP Public reports. For the level of scripting we’re doing here, some of these methods are a bit out of scope (particularly applications; we’ll save those for another series). What I’d like to do here is give you some options and good resources for each method and work through some examples for the ones that will give you the most bang for the buck in the current phase of your scripting journey.
JSL files
This is what people think of when they talk about working in JSL. If you’ve been following along in the series, this is where your script currently lives. The thing is, JSL files aren’t the best way to store or share files. They can be accidentally edited. They require someone to know how to run a script. And, to be honest, for some people, seeing the code is a bit intimidating.
JSL files should probably only be used for the most trivial of tasks or for prototyping methods for a larger project. There are exceptions, of course. If you’re creating a library of functions or something, it’s going to exist as a JSL file. There are also bits of JMP that let you provide JSL directly (for example, the code folding keywords file), but these tend to be the exception rather than the rule. My personal bias is to stop at a JSL file only as a last resort, if I’m collaborating with another coder on something or if the code is entirely for my personal use (e.g., a snippet for testing something).
Query Builder files
JMP has Query Builder support for most file types through ODBC drivers or JMP data tables. If your script involves a data manipulation step, chances are that you could probably offload a bunch of the heavy lifting to the Query Builder file and use the post-query script (more on that in a second) to do the bits that Query Builder can’t handle. Using these files as a packaging method simplifies the workflow and makes the script more robust. They also make the script portable. Plus, you gain the ability to use the built-in filter prompts to make your code even more flexible.
Let’s look at a simple example. I’m going to use the JMP data table Query Builder under Tables > Query Builder rather than the one for ODBC or SAS connections just to keep things simple, but the workflow would be similar for those cases, and there are resources to show how those work.
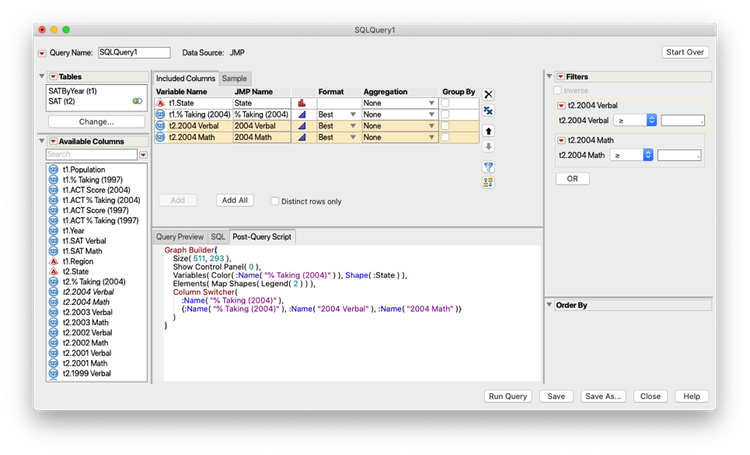
First, let’s set up a Table Query. I’m not going to write that out. The JMP documentation team did a great job with an example for the SATByYear sample data. Just follow the instructions in this example and stop after you run the query, but keep the Query Builder open. Once you have the data table, create a Graph Builder map:
- Open Graph Builder (Graph > Graph Builder).
- Drag State to the Map Shape drop zone below the Y-axis.
- Drag % Taking (2004) into the Color drop zone.
- Go to the red triangle next to Graph Builder and select Redo > Column Switcher.
- Select % Taking (2004) as what you want to switch out and click OK.
- Select all the continuous variables as what you want to switch between and click OK.
Select Done to close the control panel.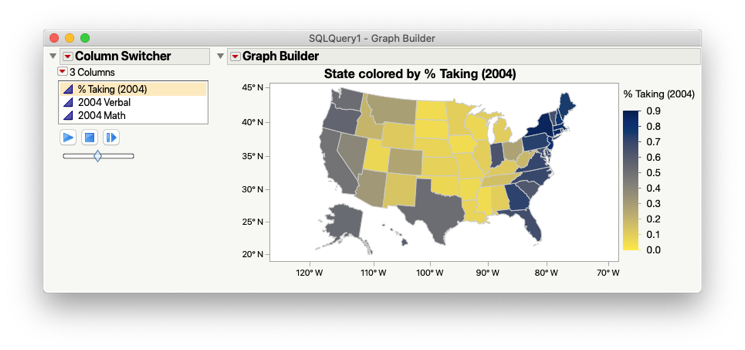
- Select Save Script > To Clipboard from the Graph Builder.
- In the Query Builder select the Post-Query Script tab in the bottom half of the window.
- Paste (CTRL+P for PC or CMD+P for MacOS) the script into the Post-Query Script tab.
- Save the Query Builder file by clicking Save.
- Now, close the data table Query Builder created and Graph Builder.
- Click Run Query.
See how that works? By using Query Builder, you got some interactivity for free in the form of the filtering dialog and were able to significantly increase the efficiency of this workflow. If someone had the two data files, you could send the Query Builder file to them and it would produce the same result.
JMP add-ins
If you want to make your code show up in JMP, an add-in is the way to go. Add-ins show up in the Add-in menu in JMP, which will only appear after you’ve installed your first add-in. They are stored in the JMP file system, so the user doesn’t have to remember where a script file is. And they provide a certain element of polish to a completed project. Admittedly, they can be a skosh intimidating at first, but they’re really easy to work with using the Add-in Wizard.
I’m going to create a really simple add-in that uses this code:
// Set up the namespace
Names Default to here(1);

// open the log window and clear it
Open Log();
Clear Log();

// write my message
Write(“Hello World!”);
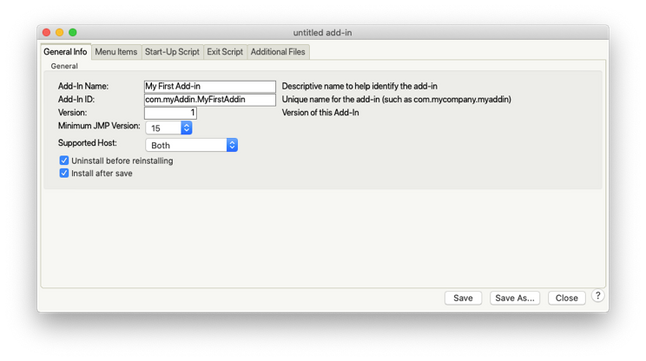
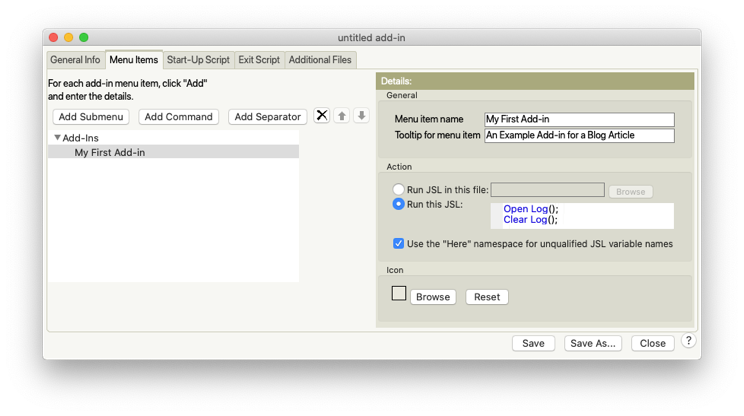
The code will open the log and print a message. We’re going to call this add-in “My First Add-in.” The first step is to open an Add-in Builder (File > New > New Add-in). After that, it’s just a matter of filling in the form. There are five tabs along the top of the interface. We’re just going to need the first two for our add-in. The first tab (General Info) is more about bookkeeping and getting JMP to know where things are. The second tab actually sets up the bits that are in the JMP GUI.
Under General Info, the Add-in Name and Version fields are pretty self-explanatory. You can limit legacy versions of JMP from running your code with the Minimum JMP Version. You can also limit your add-in to run on MacOS or Windows using the Host. I recommend setting the Minimum Version and Host to match the configuration of the system that the code was written on (unless you have the ability to test on other configurations). It’s easier than trying to make sure your code is bulletproof for all situations, particularly when you’re just starting out. The Add-in ID is a unique folder name that is created in the JMP file system when the add-in is installed. JMP recommends using the “Reverse DNS” naming convention (no idea why). It basically means you create something that looks like a website address and reverse it. For the add-in, we’ll use com.myAddin.MyFirstAddin. Here’s what the first tab should look like:
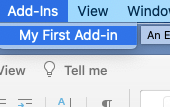
And that’s it. Just save the file, and you’re done! Because the default action (on the General Info tab) is to install the add-in when you save it, clicking Save will both create a file to send around to others and install it on your own instance of JMP. Once you’ve saved the add-in, you should see an entry like this in your add-in’s menu:
JMP applications
So, you want to make something that looks like it’s a native part of JMP? Application Builder is, in my opinion, the most flexible and efficient method for generating high-quality, custom JSL solutions. It provides you with the ability to control every aspect of the software, leverage existing parts of JMP, and use custom-designed routines. That flexibility and power does come at a cost in the form of a learning curve.
That said, you shouldn’t let it intimidate you. There are lots of resources out there for getting started with Application Builder, and the things that you can do with it are incredible. It’s just going to take some work to get up and running. There’s also a “lite” version of Application Builder built into JMP. You’ll know it as the drag-and-drop tool called Dashboard Builder. Once you’ve got a bit of experience with JSL, taking the Application Builder course from SAS Education would not be a bad way to learn about this very powerful tool. I’m also toying with doing another “Five Things” series on this topic at some point, so keep an eye out for that!
JMP Live and JMP Public
While JMP Live and JMP Public are heavier on the "consume" end of things, you can create and publish dashboards and reports for others to consume using this method. For the most part, you’re just using the bits of JSL that I’ve shown you in this series. Dan Valente did a great blog post on scripting the JMP Live (and JMP Public) publication process, so I’m not going to belabor the point.
Homework
Well, you made it! The last homework assignment is really easy. Package up your code, give it to a colleague, and have them try it out and see if it works. If it doesn’t, look at the error messages and figure out why. If it does, then you’ve made your first JMP add-in! Nice work.
Where to go from here
Like I said earlier, this series was not meant to blow your hair back and dazzle you with my scripting prowess. It was meant to point your nose in the right direction, give you a good map, a pat on the back, and some help to reach out to in case you get stuck. It’s a starting point; there’s still a lot more road ahead of you than there is behind you.
So, from here, the trick is to keep trying and experimenting. Keep taking people’s add-ins and applications apart to see how they work. Keep trying new things and looking for opportunities to make your workflow more efficient with little scripts. The more you do that, the better you’ll get and the more approachable the bigger projects you’re thinking about will seem. Just keep at it.
- © 2026 JMP Statistical Discovery LLC. All Rights Reserved.
- Terms of Use
- Privacy Statement
- Contact Us

You must be a registered user to add a comment. If you've already registered, sign in. Otherwise, register and sign in.