Recurrence: An analysis of adverse events whose time has come in clinical trials
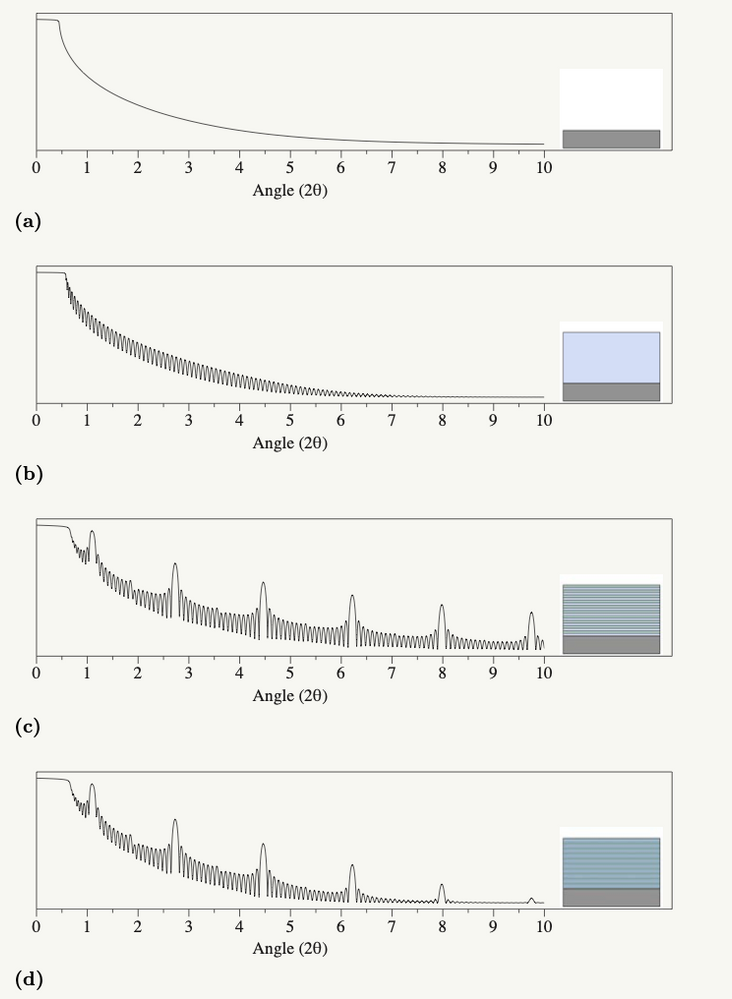
A recurrence analysis acknowledges that an adverse event may occur more than once within a patient over time and accounts for these re-appearances within the analysis. Going further, recurrence analysis accounts for the timing at which the events occur. The Recurrence Report in the forthcoming JMP Clinical 19 makes it easy to screen a clinical trial for noteworthy safety issues while considering p...
 Richard_Zink
1568 views
|
0 replies

 Byron_JMP
 dieterpisot
 Wendy_Murphrey
 MikeD_Anderson
 Victor_G


 Jed_Campbell

 anne_milley