JMP 16 new features in Control Chart Builder – part 1
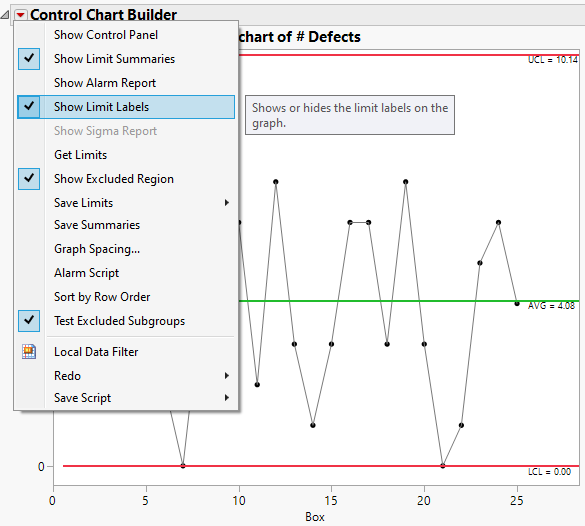
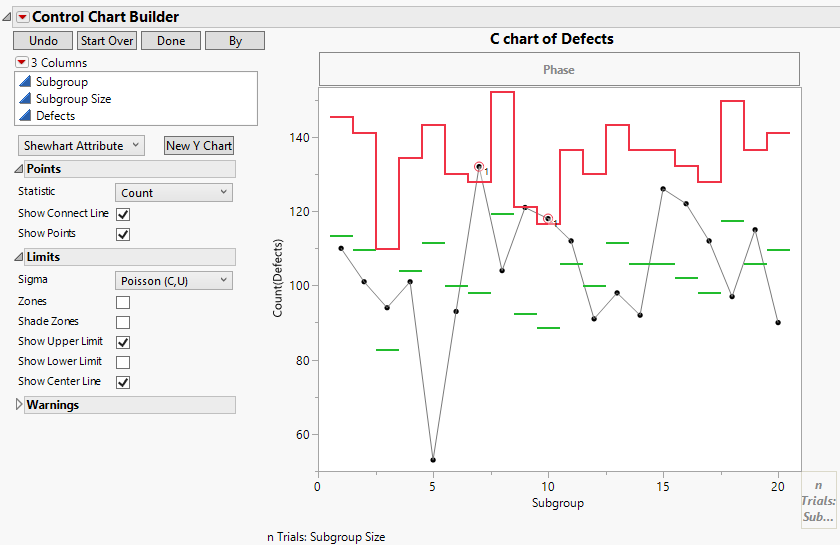
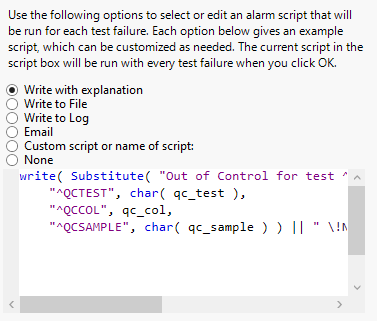
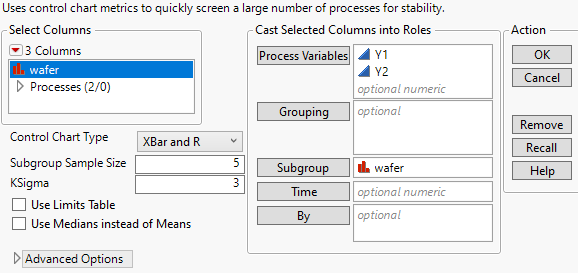
Control Chart Builder is an interactive workspace which allows you to monitor process variation. This blog post details the new features introduced for Control Chart Builder in JMP 16.
Control Chart Builder is an interactive workspace which allows you monitor process variation. This blog post details the new features introduced for Control Chart Builder in JMP 16 that specifically deal with tests and alarms. To see other new Control Chart Builder features that do not deal with tests or alarms, please see my previous blog post “JMP 16 new features in Control Chart Builder – part...
Cumulative Sum (CUSUM) control charts enable you to detect small shifts in a process. They are useful in detecting shifts that occur over time, such as a gradual drift, and that are not necessarily accompanied by a sudden shift. This blog post details the new features for CUSUM Control Charts that are available in JMP 16.
Process Screening enables you to explore a large number of processes across time. Several new features were added to this platform in JMP 16. This blog post details the new features for Process Screening that were introduced in JMP 16.
The first installment of our new Advocating for Analytics series.
Part two in our ongoing series Advocating for Analytics.
Advocating for Analytics: W. L. Gore W. L. Gore's John Szarka says the Early Adopter program lets users have a voice in the development process.
Advocating for analytics at PCC Structurals
Advocating for analytics at W. L. Gore & Associates
A Q&A on mature analytics cultures, mentorship and more
The best opportunity all conference long to engage with industry peers and JMP staff around our shared enthusiasm for predictive modeling.
Suppose you are making parts, and some small percentage of those parts are susceptible to an early life "defect" that causes them to fail, while the rest of the population doesn't have the defect and will never fail because if it.
Rational subgrouping is the process of organizing the data into groups that were produced under the same/similar operating conditions. Several new subgrouping features were added to the Process Screening platform in JMP 16.1 to make this analysis more flexible and user-friendly. You can now specify multiple subgroup columns. Individual and Moving Range charts with a subgroup role now create a det...
A Q&A on developing analytics thought leadership
When traveling by train from Paris to Geneva, you have two options: high-speed train or regional train. The high-speed train will get you there in 3 hours and 5 minutes. The regional train takes 8 hours and 35 minutes. While the high-speed train is the fastest and most comfortable, the regional train does not require you to reserve a seat and allows you to stop in beautiful cities along the way li...
JMP for Mixed Models by Hummel and Claassen
Lee Laim of MicronAs part of our Advocating for Analytics series, Innovation Manager Lee Laim discusses Micron’s analytics culture and the symbiotic relationship of domain expertise and statistics.
Advocating for Analytics at Johnson & Johnson Vision Alicia Garcia-Tunon is a process engineer and statistical advocate at J&J Vision.
Advocating for Analytics at Novozymes
We are committed to continually improving JMP Live, and JMP 16.1 is no exception. In our latest release, we have focused on improving the experience around administrating your JMP Live instance.