JMPer Cable
A technical blog for JMP users of all levels, full of how-to's, tips and tricks, and detailed information on JMP features- JMP User Community
- :
- Blogs
- :
- JMPer Cable
- :
- The new thing I'm going to show people when they start scripting: The Enhanced L...
- Subscribe to RSS Feed
- Mark as New
- Mark as Read
- Bookmark
- Subscribe
- Printer Friendly Page
- Report Inappropriate Content

Normally, when I write a series like this, I write the whole thing – start to finish – before I start publishing anything. Normally, I don’t want to leave my readers hanging while I write the next entry. Normally, I try to avoid the stress of writing under a deadline. Alas, there is nothing normal about this entry. This entry is being written as the other entries are being published. I normally wouldn’t attempt something like this, but the information that I’m going to share here is not just salient to the discussion, it completely changes how I’m going to approach this topic going forward. As a refresher, here are the links to the other entries:
- The 1st thing I wish I knew when I started scripting: There are different kinds of scripts
- The 2nd thing I wish I knew when I started scripting: Getting help
- The 3rd thing I wish I knew when I started scripting: The Answer Button is your friend
- The 4th thing I wish I knew when I started scripting: What to do when things go wrong
- The 5th thing I wish I knew when I started scripting: How to string things together
- The (other) 5th thing I wish I knew when I started scripting: How to package things up
And now, let’s turn nearly everything I just finished telling you over the past weeks on its ear.
There is a cycle to how JMP releases work. Usually, the Product Management team doesn’t start discussing the new release with the general public until about two or three months before the release date. So, you can imagine my shock when I was given the green light to write about this new capability – a full six months before JMP 16 is slated for release.
As I sat in a meeting where the developers demonstrated this new capability to JMP staff, I shared my excitement about this feature and my eagerness to show it to customers. Imagine my surprise when, later that day, I was asked to write an article about it. So, what is this magical feature that has my heart all aflutter? What has me breaking out my thesaurus, scrambling for new superlatives? What is the new feature that’s going to completely alter how I introduce people to the world of JMP scripting? Well…and, stay with me here…it’s actually the log.
A preview of things to come
JMP 16 will introduce a new log, currently called the Enhanced Log. But, that’s a bit like saying a smartphone is a thing to make phone calls (you do remember they do that, right?). The Enhanced Log tracks a fair bit of what you do when you interact with JMP and (here’s the awesome part) will generate JSL for it with a mouse click! Let that sink in for a second.
This goes way beyond Source scripts and the red triangle Save Script options. They’re not trying to boil the ocean, so some stuff isn’t going to be captured in the first release; data import and data table manipulation are the primary goals for JMP 16. But it covers a lot of ground right out of the gate. Let me show you what this thing is already able to do (with six months of development time to go).
Turning on the Enhanced Log
First things first, turning on the Enhanced Log is as easy as going into the preferences in JMP (under JMP > Preference for MacOS; File > Preferences for Windows) and changing the Log Style drop-down to “Enhanced.” Click OK and you’re off to the races! (note the screenshot below is from an early release and the log now has its own menu item toward the bottom of the list.)

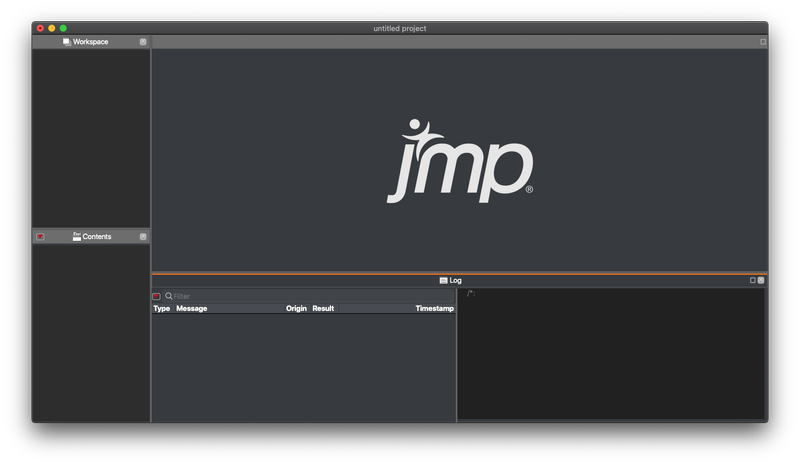
Now open the log (Window > Log for MacOS; View > Log for Windows). You’ll see something that looks a little different than you’re used to. I’ve cleared mine out in the screenshot, just so you can see the different regions. The top part is where actions will be recorded, which I’ll cover in a moment. The bottom part is where the JMP generated JSL will appear.
How that fits into our story
I’ve put everything into a JMP Project, just to keep everything organized. When the Enhanced Log goes into a project, it’s automatically put at the bottom and goes into a side-by-side configuration (Enhanced Log on the left; the JSL output on the right).
Since this isn’t meant to be a blow-by-blow discussion of how I did things, I’m just going to go through a few steps and point out some things. But I’m going to use the same example we used back in my third post. If you’ve been following along, have a look back and compare how easy this is now.
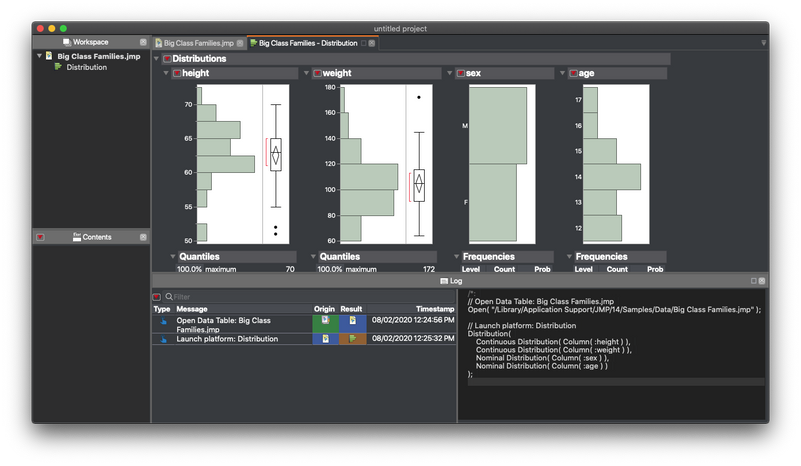
First, let’s get some data into JMP. I opened Big Class Families.jmp. The Enhanced Log area has an entry that shows the action was a user click (under Type), what it did, where the action came from in JMP (under Origin), and what happened. It also has a nice time stamp. Now have a look at the JSL area. There’s an Open(…) command (properly commented!) ready for you to use! No diving through the Scripting Index required!
Let’s continue with our analysis. I made a Distribution with the Height, Weight, Sex, and Age columns. In the Enhanced Log, there is now an entry showing that a user command started with a data table and resulted in a Distribution Platform window. In the JSL area, I’ve got the properly formatted (and commented!!!) entry to reproduce the Distribution platform.
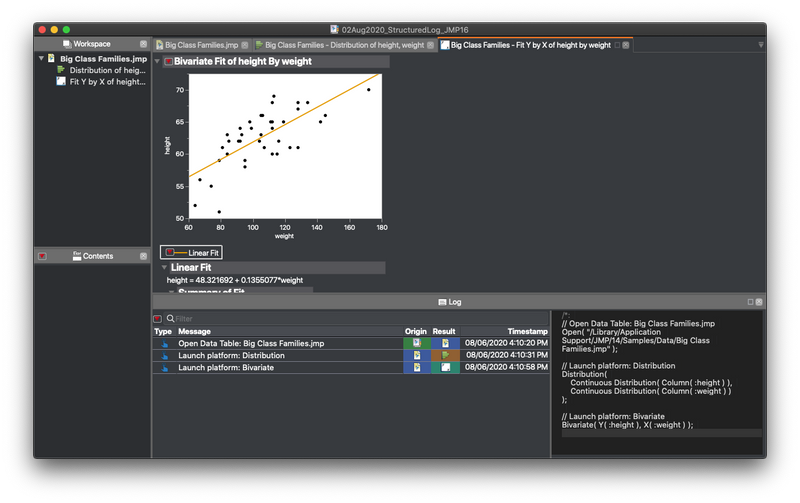
Now, let’s do a Fit Y by X of Weight vs. Height. The same story – there’s an entry in the Enhanced Log and JSL areas.
But, that’s not generally why we open Fit Y by X, is it? We want to do line fitting or hypothesis testing. If we do that, there isn’t an update to the Enhanced Log or any new JSL code.
We appear to have hit a roadblock. But wait! We haven’t, have we? We haven’t followed the JMP Workflow yet! So (following the workflow) the question is, how do we get the Enhanced Log to capture the changes we made to Fit Y by X by fitting a line? As always, the answer is found by PUSHING THE ANSWER BUTTON! For those who missed my first blog series, I call the little red triangle the Answer Button.) Since we’re in a JSL blog series, we’re going to the Save Script To… part of the little red triangle menu, where we find a new entry, To Log.
Clicking that puts a new pair of entries in the Enhanced Log for Fit Y by X with the fitted line options on.
So. Freaking. Cool.
Side note: Did you notice that it’s also handling the glue operators (;)?
Now, the last bit. How do we get that JSL out of the Enhanced Log? Well, I just asked a question, so let’s push the answer button for the Enhanced Log. And, there we find a Save Script > To Script Window option.
And we’re done! I could delete the extra Bivariate call (the first one, without the line) and put the two report windows into a New Window() function, but the point here is that I got 80%, maybe 90% of the way to a completed script without writing a lick of code. IT EVEN COMMENTS FOR YOU!!! (I’m totally geeking out at the moment…hold on a sec…I need to take a breath.)
Here's the finished code, if you want to play with it (Note: I did change the file path so that it would work on other versions of JMP):
// Open Data Table: Big Class Families.jmp
Open( "$SAMPLE_DATA/Big Class Families.jmp" );

// Launch platform: Distribution
Distribution(
            Continuous Distribution( Column( :height ) ),
            Continuous Distribution( Column( :weight ) ),
            Nominal Distribution( Column( :sex ) ),
            Nominal Distribution( Column( :age ) )
);

// Launch platform: Bivariate
Bivariate( Y( :height ), X( :weight ) );
Bivariate( Y( :height ), X( :weight ), Fit Line( {Line Color( {230, 159, 0} )} ) )
Where to go from here…again
Here we are at the end of the blog series…again. I promise this time is for real. So, what’s your homework for this entry? Well, you might be tempted to just sit on your hands and wait for Enhanced Log to arrive. I know it’s tempting, but I recommend that you practice what we’ve gone over in the earlier episodes. It’s important stuff, and you should use what you’ve learned. Good luck and happy coding!
You must be a registered user to add a comment. If you've already registered, sign in. Otherwise, register and sign in.
- © 2026 JMP Statistical Discovery LLC. All Rights Reserved.
- Terms of Use
- Privacy Statement
- Contact Us


