- New to JMP? Let the Data Analysis Director guide you through selecting an analysis task, an analysis goal, and a data type. Available now in the JMP Marketplace!
- See how to install JMP Marketplace extensions to customize and enhance JMP.
JMPer Cable
A technical blog for JMP users of all levels, full of how-to's, tips and tricks, and detailed information on JMP features- JMP User Community
- :
- Blogs
- :
- JMPer Cable
- :
- The 4th thing I wish I knew when I started scripting: What to do when things go...
- Subscribe to RSS Feed
- Mark as New
- Mark as Read
- Bookmark
- Subscribe
- Printer Friendly Page
- Report Inappropriate Content

If you’re just joining us, you’ve jumped in right in the middle of a series that aims to get people started with using JMP scripting language. Unlike the previous entries in the series, you probably don’t need to read the others for this one to make sense, but if you want to play along and do the homework from the other entries, here are the links
- The 1st thing I wish I knew when I started scripting: There are different kinds of scripts
- The 2nd thing I wish I knew when I started scripting: Getting help
- The 3rd thing I wish I knew when I started scripting: The Answer Button is your friend
Also, a big thanks to Christian Stopp (@ChristianStopp) for suggesting this entry in the series.
This part of the series is very much a standalone entry. But, in the flow of things, this is probably the point where you’ve started to play with some code and may have seen an error message or two. So, before we start with any serious code wrangling, let’s cover what do to when things go sideways.
The most common mistakes in JSL
Justin Chilton (@Justin_Chilton) and Wendy Murphrey (@Wendy_Murphrey) are among the best scripters at JMP. At the 2020 Americas JMP Discovery Summit, they (virtually) presented a paper titled, “The Most Common JSL Mistakes and How to Avoid Them.” The PowerPoint file for that presentation can be found here on the Community.
For the new scripter, this is 14 pages of solid gold. In the context of what we’re doing in this series, some of it is a bit out of scope but will be invaluable for the next steps in your scripting journey. Just do me a solid, download the pdf, put it somewhere that you won’t forget about it, and give the paper a thumbs up on the Community page.
Mike’s most common JSL mistakes
As a bit of a riff on Justin and Wendy’s work, I want to add a couple of things to their list. These are pretty basic and will generally cause a script to crash before it’s even run (which is why they don’t show up in the Discovery Summit paper).
Glue
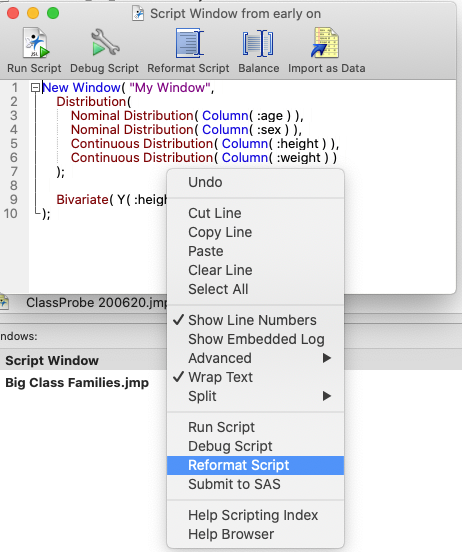
Missing Glue Operators are probably the most common JSL mistake out there. Like I mentioned before, the Glue Operator is the semicolon (“;”) that you see at the end of every instruction in JSL. If you’re saving scripts to a script window using the red triangle menu (see the previous post), JMP will add the glue where it needs to go. If you’re writing code manually, there’s a trick that you can use to make sure you haven’t forgotten one somewhere. Right-click in the Script Editor and select Reformat Script.
This trick will actually catch a lot of basic syntax related errors in the script. There is also a keyboard shortcut when you are in the Script Editor (it doesn’t work in “script editor boxes” though). I prefer the keyboard shortcut myself. For Windows, it’s CTRL+M. For MacOS, it’s CMD+M.
Now, before I show you how to unpack what Reformat Script tells you when there is an error, let me show the other error that drives me nuts. Since they both use a similar debugging workflow, this will make sense in a second, I promise.
Parentheses
Getting your parentheses (brackets, braces, etc.) out of place (or missing) is probably the most insidious bug to track down. And I do mean it is a special kind of frustrating. There is one tool that you have available in JMP to help you with tracking down mismatched pairs of parentheses. When you put your cursor on the outside of a parenthesis, the Script Editor will highlight it (and what it thinks its match is) in blue.
If the Script Editor is confused, or can’t find a match, it will highlight the parenthesis in red.
So, if the blue match for a parenthesis is not where you expect it to be, or if the parenthesis is highlighted in red, you probably have a problem.
When you get errors for missing parentheses, you might be tempted to just keep adding them to the end until the error goes away. Let me just say that’s a bad idea and move on to some better strategies for this issue and for the issue of missing glue. And they both revolve around setting up JMP’s Script Editor.
Setting up (and using) the Script Editor for success
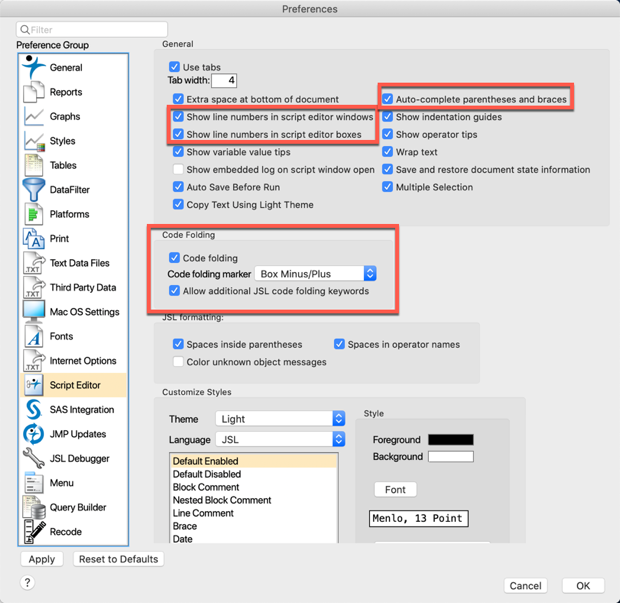
The JMP Script Editor (we saw it in the previous post) has a number of features that make working with code and debugging easier. I have these on by default in my preferences, and I’d suggest you do the same. To access the JMP Preferences Dialog, select Preferences from either the JMP menu (MacOS) or File menu (PC).
I’ve highlighted the options that I find really useful in the screenshot. The code folding comes in handy for larger scripts. The line numbers and autocomplete options are more important to our current discussion.
How to use the log
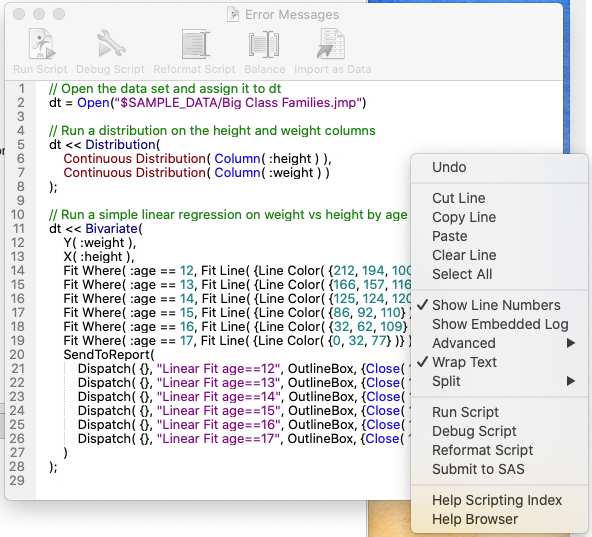
Now that we have our Script Editor set up, let’s learn how to use the log. First, to open the log, go to View > Log (Window > Log on a Mac). This will open a window that looks similar to a Script Editor. It is different from the Script Editor in that it shows the output and results of the commands run in the Script Editor. If you would prefer to keep your input and output in the same window, you can turn on the Embedded Log in the Script Editor by right-clicking in the Script Editor and selecting Show Embedded Log.
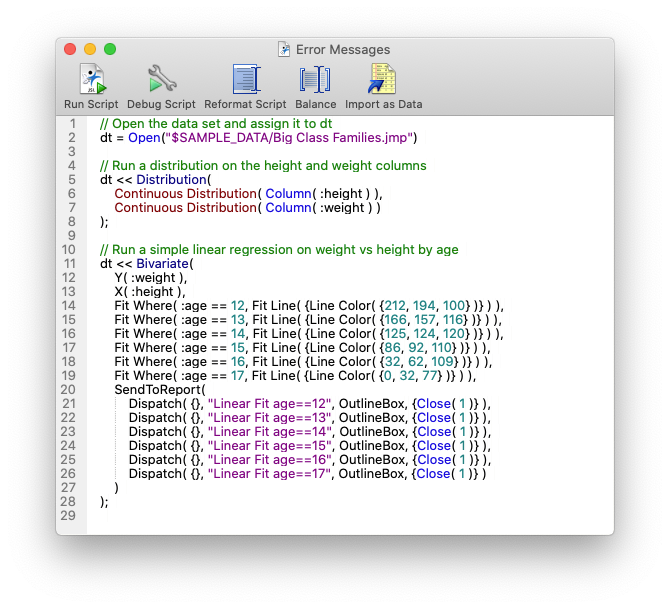
Let’s have a look at how it works using this script:
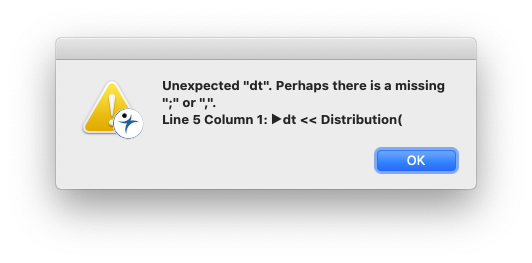
The script is pretty simple. Aside from line 2 and the comments, it was created using Save Script…To Script Window. If I run Reformat Script (also found by right-clicking in the Script Window), I get the following error message:
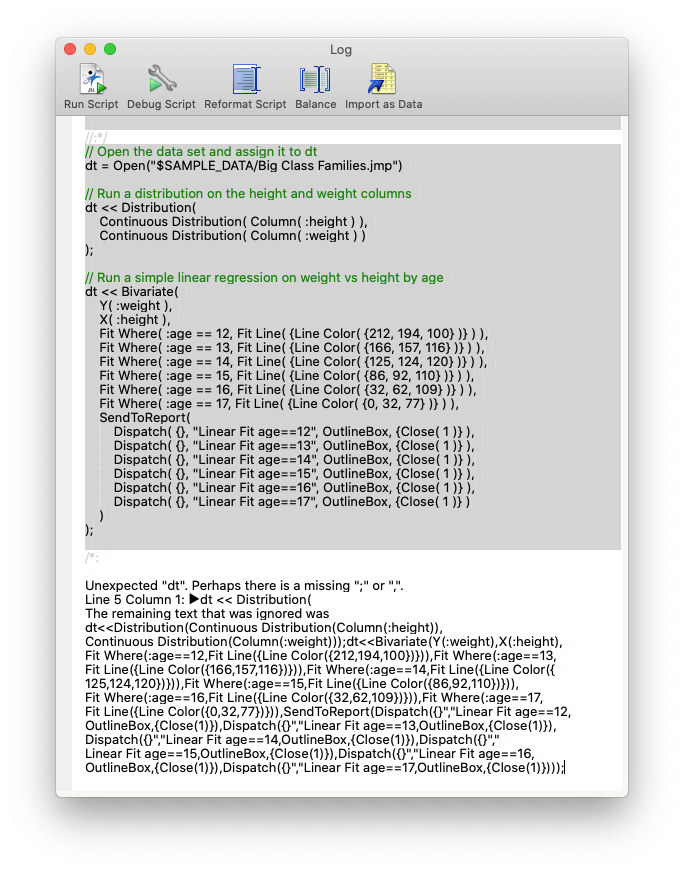
In the log, you get something similar:
In the gray area, you can see what was input. Below it, you see a message about something unexpected and a suggestion about what could be the problem. In this case, JMP thinks there is missing glue (;). It also tells you where the unexpected input came in the script with a line number. Since JSL is run sequentially (from top to bottom), this means that the error is somewhere above line 5. Because we’ve got the line numbers turned on, we can see that line 2 is missing the Glue Operator, which means JMP isn’t expecting a new command to start at line 5 and is caught by surprise. After adding the semicolon at the end of line 2, running Reformat Script shouldn’t return any errors.
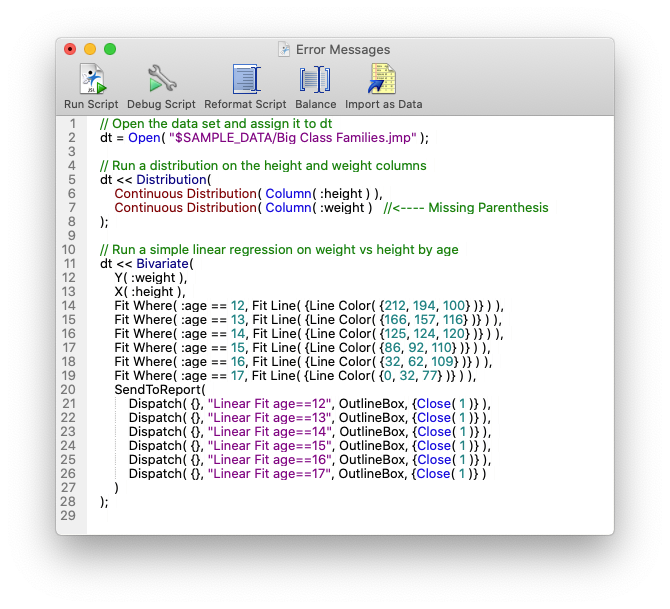
Similarly, if we’re missing part of a bracket pair (e.g., parentheses), like this (notice line 7):
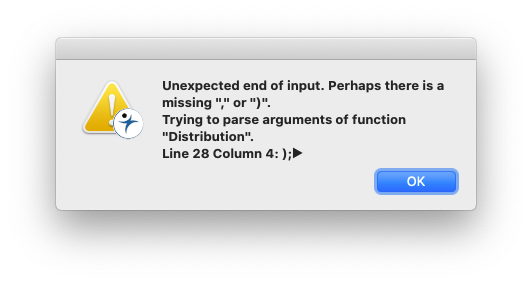
we would get this error message:
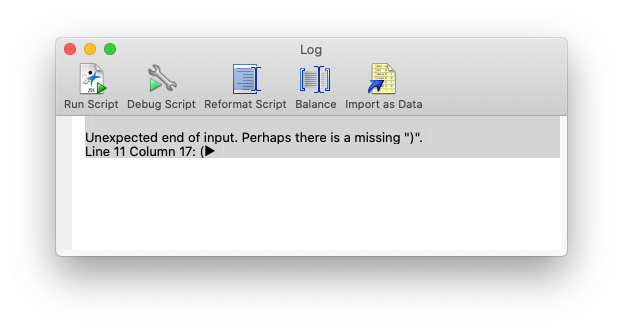
with a log message:
These messages from JMP are a little less clear-cut, but here’s how to interpret them. First, from the error message, we know that the problem is in the Distribution. Between the log and the error message, it’s most likely that there is a missing parenthesis somewhere. The log says that the something unexpected happened at line 11 (the “Column …” can sometimes be helpful, but you have to count characters to use it). The color highlighting the parentheses shows that the first one is missing its pair (note the red color on the parenthesis next to Distribution in line 5 after placing the cursor to its left).
Work forward using the highlighting to figure out where the missing one should go (line 7 in this case). For the most part, the log is a really useful window into what JMP thinks is going on. However, if you want to check your JSL for errors or work through the code stepwise, there’s another tool for that.
How to use the JSL Debugger
The JSL Debugger is a bit of an odd beast. If you’ve accidentally hit the debugger button:
you probably already know that it locks up the main interface in JMP while running. When I started scripting, I really didn’t use it a lot. Now that I’ve had a few chats with the development team about it, I can say that I’m coming around to it. Let’s talk a bit about it and what it can do.
First, that bit about it locking up JMP. It’s a little confusing, but what it’s actually doing is creating a second instance of JMP to run the debugging. The main instance of JMP isn’t going to be responsive as long as the JSL Debugger is active. If you close the JSL Debugger, you’ll get control back.
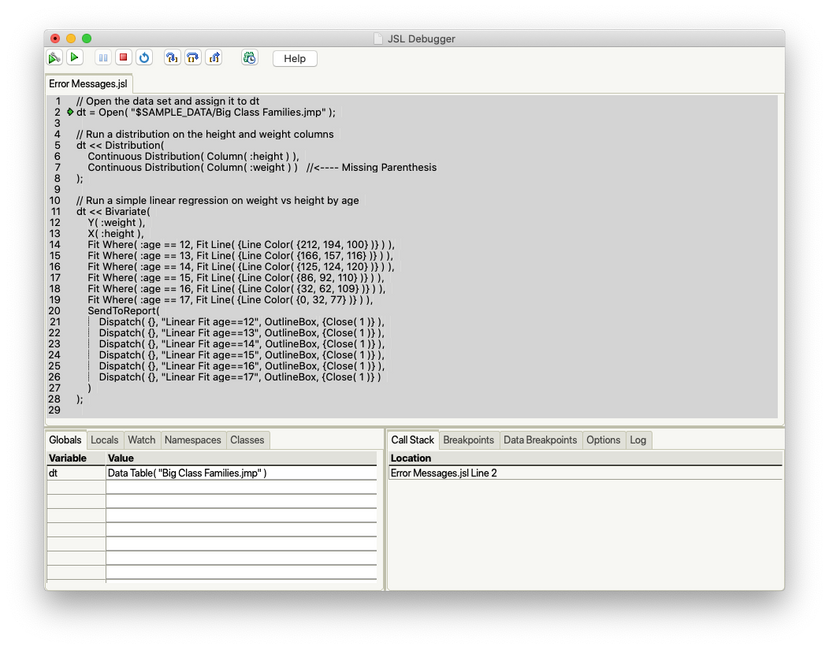
When you launch the JSL Debugger, in addition to another instance of JMP, you get the JSL Debugger window. This window contains your code, lists of the different variables, a log, and other information. It looks something like this:
When you’re debugging, this window is your eyes and ears into what your script is doing in JMP. If you’ve got a second screen, move it over there, so you can always see it (sometimes it can get buried behind other windows).
Now, I could go crazy with describing everything that you could do with the JSL Debugger, but the documentation has a great chapter (with examples!) that you can find here.
There is also a good blog post by Melanie Drake (@Melanie_J_Drake) that covers some of the cool things that you can do with the JSL Debugger. So, if you want to go into the weeds a bit, have a look at those. For our purposes, I want you to pay attention to these buttons:
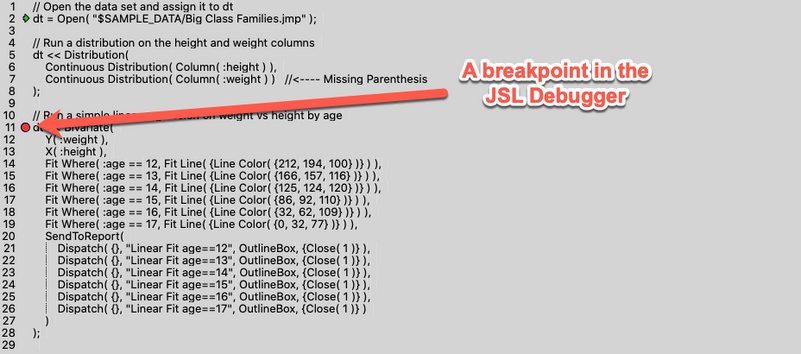
The first two run the script. The first one runs the script to its end or to where it encounters a breakpoint (a point that you want to stop evaluation if you don’t want to run the entire script). You can set a breakpoint in your code by right-clicking next to the line number in the JSL Debugger. A red dot will appear next to that line (the breakpoint needs to be on a line of code, not a comment!).
If you were to run this script using the first Run button, it would run until line 10 and then stop. A second press of the Run button would then finish the script. The second Run button runs the entire script without paying attention to breakpoints. The red Stop Button exits the debugger, which is useful if you opened it by accident or have finished your debugging session. The Repeat button resets everything to run the script again (e.g., if you want to change where a breakpoint is and then rerun the code).
Homework
The homework this week is pretty light. I want you to get the Script Editor set up, find the log, and start playing with the JSL Debugger using some of the example scripts from the documentation. Have a look at which variables pop up in the tabs on the lower left of the debugger window. Also, find the Log tab in the lower right (so you know where it is).
Next week, we’re going to get into the last bit of the “coding” we’re going to cover in this series.
You must be a registered user to add a comment. If you've already registered, sign in. Otherwise, register and sign in.
- © 2026 JMP Statistical Discovery LLC. All Rights Reserved.
- Terms of Use
- Privacy Statement
- Contact Us

