JMPer Cable
A technical blog for JMP users of all levels, full of how-to's, tips and tricks, and detailed information on JMP features- JMP User Community
- :
- Blogs
- :
- JMPer Cable
- :
- The 3rd thing I wish I knew when I started scripting: The Answer Button is your ...
- Subscribe to RSS Feed
- Mark as New
- Mark as Read
- Bookmark
- Subscribe
- Printer Friendly Page
- Report Inappropriate Content

- The 1st thing I wish I knew when I started scripting: There are different kinds of scripts
- The 2nd thing I wish I knew when I started scripting: Getting help
Have a look; it will help you with what’s coming up.
All right, buckle up. Thus far we haven’t actually worked with any code (unless you count the JSL Scripting Index). That ends today. Today we are going to use the JSL script window. I know that can be anxiety-inducing to some of you. Let’s take some deep breaths and get to it.
Don't script for the sake of scripting!
Let’s be honest about something: Coding is not an efficient process in the short term. For one-off analytics and graphics, drag-and-drop tools are going to almost always beat out coding in terms of ROI (the cost of someone going through a development exercise is just too great). There are those who insist on scripting regardless of whether a GUI solution is faster. I don’t know why, and I am not in their number. I will consider coding when a workflow is difficult or circuitous enough that using a GUI introduces a significant chance for errors down the road. I will also consider coding when I’m going to do something over and over again and I can justify the time through the efficiency I gain by automation. That’s not to say I don’t code just to see if I can do something. Or that I don’t choose a more convoluted way of coding just to learn something new. But those cases are the exception rather than the rule.
Now, I’ve probably tweaked a few people’s noses with that generalization. The problem with this kind of blanket statement is that it’s pretty black and white. The truth, just like everything in life, is that there’s a gray area where the value proposition is a toss-up between a point-and-click solution and coding. The gray area also happens to be where most aspiring coders find themselves. They know they can probably gain some efficiency through scripting, but they just don’t know where to start or they are worried that the time lost to the initial learning effort will be too great. What’s nice about the design of JMP is that it gives us tools that we can use to start introducing JSL into a workflow without losing too much efficiency when manipulating JSL. And, like all things in JMP, it starts with The JMP Workflow.
The JMP Workflow (scripting edition)
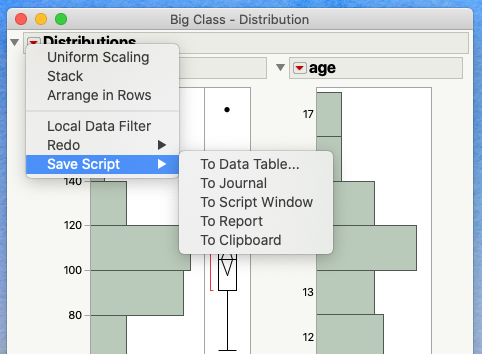
The JMP Workflow generally ends with a user going to a red triangle menu to answer a question. Another function of the red triangle menu is to provide methods for users to save their work (save scripts).
There are three main ways to save scripts:
- To Data Table: This method saves the scripts to the data table as "Table Scripts." These scripts save the method used to generate a given report in JMP and are portable (i.e., can be copied and pasted between data tables with the same column names).
- To Script Window: This method saves the information needed to reproduce a given report to a script window. It is useful for multiple-step operations or producing multiple reports. The contents of a script window can be turned into a table script as well.
- To Clipboard: This method is useful for moving the code needed for a report into other JMP Platform (e.g., Query Builder, Application Builder, etc.) or for generating prototype code for larger projects.
It turns out that really efficient coders will leverage these red triangle options extensively during their coding sessions. They use them to speed up their coding (why pound keys when you don’t need to?) or generate platform prototype code that would otherwise be easy to mess up and difficult to debug. For the beginning coders, these options provide different opportunities to learn about and utilize JSL while easing into the details of working with it. This is where we want to start our coding adventure.
Save Script > To Data Table
If you happen to be a JMP user in the NY or NJ area: Hi! I’ve probably visited your company at some point. (If not, drop me a PM; we need to fix that.) And, when I’ve come on site, you’ve probably heard me harp on this point: You MUST save your work, and by “save your work,” I mean use the Save Script…To Data Table option under the red triangle menu. Going back to my first experience with automating a workflow, this is how I started: by saving a bunch of standardized Graph Builder reports to a JMP table that I would regularly update. I cannot stress strongly enough the of power this one little tip. It’s like having Dr. Who’s Sonic Screwdriver. The possibilities are endless.
Let’s look at a quick example:
- Open Help > Sample Data Library > Big Class Families.jmp
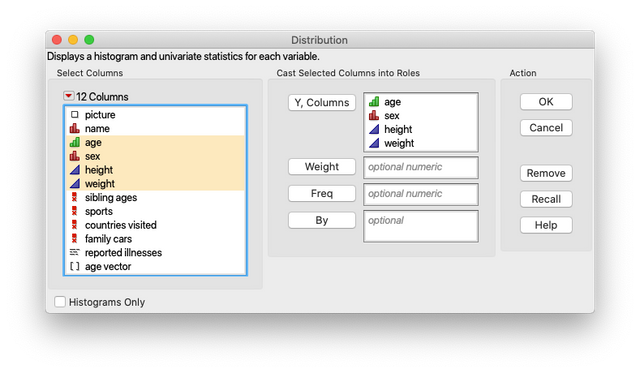
- Open a distribution dialog: Analyze > Distribution
- Put age, sex, height, and weight into Y, Columns and click OK.
- Under the Distributions red triangle menu, select Save Script > To Data Table
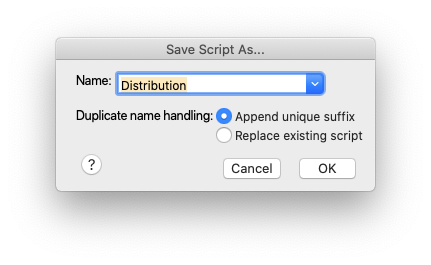
- Give it a name (or just use the default). If you use the default in this case, it will show up in the data table as Distribution 2 because there’s already a Distribution script in the data table.
- Now look back at the data table in the upper left corner. You should see your table script in the list with a green check mark next to it.
In the context of this series, those table scripts can be thought of as little applets (mini applications) or macros. They are directly portable between data tables (just copy and paste), provided the column names used in the script are the same. They can also be edited (right-click on one and select Edit). So, they are also portable to data tables that don’t have the same column names if you are willing to edit the column names in the script, which is not a big deal. We’ll cover how to do that in the next post. Table scripts can also be used to string smaller scripts to automate a larger workflow. We’ll also cover that in the next post.
Save Script > To Clipboard
We’re going to cover the last entry in the red triangle menu: to clipboard item. We’re going to cover this one next because the entry is identical to the to Script Window option, but a lot less instructive. That’s not to say it’s not useful, just that you can’t see what’s going on. So, for the sake of time, here’s what it does. It takes the code that is created by Save Script…To Data Table and puts it in the clipboard so that you can put it in another script somewhere. It’s handy. And, as your scripting skills grow, you’ll figure out where it’s useful for you. For the moment, I want to back up into the more interesting and useful option: saving to a script window.
Save Script > To Script Window
The next entry in the Save Script to… red triangle menu, we are going to cover what is probably the most instructive of the three I’m discussing. Saving a script to a script window does just what it says: It creates a Script Editor window (we’re going to go deeper on the Script Editor in the next episode) and populates it with JMP-generated JSL to recreate whatever was in the window you were working from. The important point with this entry is that you can study the code and learn from what JMP generated.
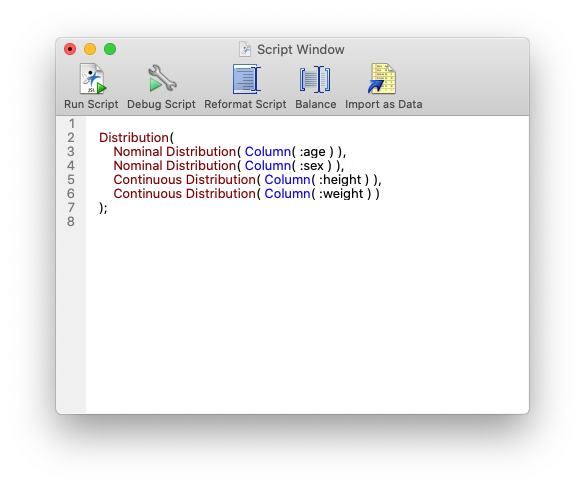
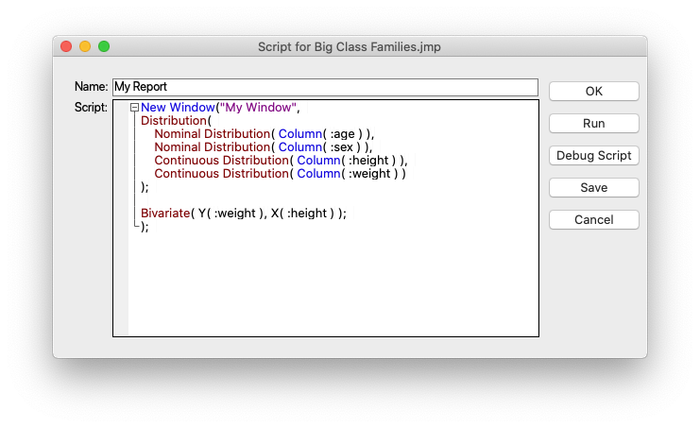
Let’s look at a trivial example using Big Class again. Go ahead and click the green button next to your saved script to rerun the analysis. Then, in the report window, select Save Script > To Script Window from the red triangle menu. Now, look at what JMP has written in the Script Window.
JMP has created a Distribution Report: Distribution(…);. JMP has put two Nominal Distribution subgroups into the report: Nominal Distribution(Column(…)) and two Continuous Distribution subgroups: Continuous Distribution(Column(…)). At the end of the script, JMP has put an incredibly important piece of code: the “;”. It’s called the “Glue Operator” and we’ll cover it in more detail in the next episode. For now, you just need to know that it’s a way to signal to JMP when it’s running the code that another instruction is coming. The fact that JMP puts that on the end automatically makes the novice scripter’s life a lot less complicated.
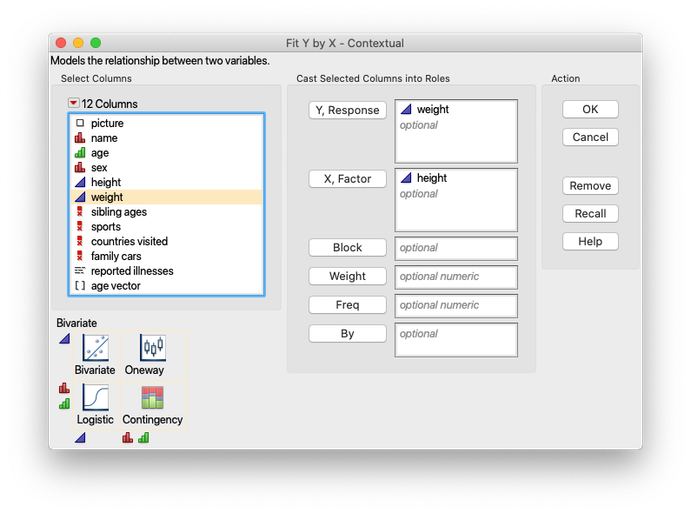
The last point that makes this entry so useful is what happens if you leave that script window open. Go ahead and close the Distribution Platform, but leave your Script Editor open. Now, using the open data table, create a Fit Y by X report (under Analyze) using Height as the X variable and Weight as the Y variable.
Next, select Save Script to Script Window again.
Did you notice how the window was updated with another entry? That script will now recreate the two windows you were just working with, once you know how to run one. Speaking of which…
Running scripts
So, you’ve got some code in a script window, now what? You probably want to be able to run the code that you’ve created. I mean, you could just leave it up to impress people that walk by your desk, but it’s probably better to run it. There are a few ways to run code in JMP: the main menu, keyboard shortcuts, the tool bars at the top of the scripting window, the Enter key, or just right-clicking. Let’s quickly go through each of these.
The main menu and keyboard shortcuts
The Run Script command is in the same place in Windows and MacOS. If you’re in a scripting window, go under Edit > Run Script. The hotkey for this is CTRL+R for windows and CMD+R for MacOS.
The tool bar button at the top of the scripting window
If you look at the top of the script window, you should find a Run Script button (unless you’ve got the tool bars hidden). In Windows, it looks like a little green play button, similar to the ones for table scripts. In MacOS, it looks like a little JSL document with a JMP Man and the green play button.
Using the Enter key
Note here that I mean the button in the lower right part of the number pad on an extended keyboard. If you push that button, JMP will run the line of JSL where the cursor is located. I used this one a lot before I got comfortable with the JSL Debugger.
Right-clicking
Selecting some code and right-clicking will bring up a context menu that has a Run Script option toward the bottom.
I recommend that you try the different forms of running scripts and find the one that you like best. I’m partial to the hotkey, except when I’m in Application Builder, where I prefer using the tool bar options. Over time, you’ll probably gravitate to one or two that become your favorites. Also, as a side note: All of these options do slightly different things depending on whether you have a section of code selected, your cursor is at the end of a line, or your cursor is on a blank line. So you might want to experiment a bit with that, too.
Wrapping up for this week
All right, believe it or not, you’ve now got enough information to be insanely dangerous with JSL...in a good way, of course. Let me show you what I mean.
Let’s use that script we created today. I’m going to make one little tweak by wrapping a New Window(); function around the distribution and bivariate functions JMP created. You can learn more about New Window(…); in the Scripting Index. Note that the first part of New Window(…); starts on line 1 and the last part is on line 10! I’ve got my Script Editor set up to draw a nice little line connecting them so I can see where they are (more on that later).
Then, let’s copy the text for that script and go back to the data table. Select New Script from the red triangle menu in the uppermost left corner of the data table.
Paste the script text into the dialog, give it a useful name and click OK.
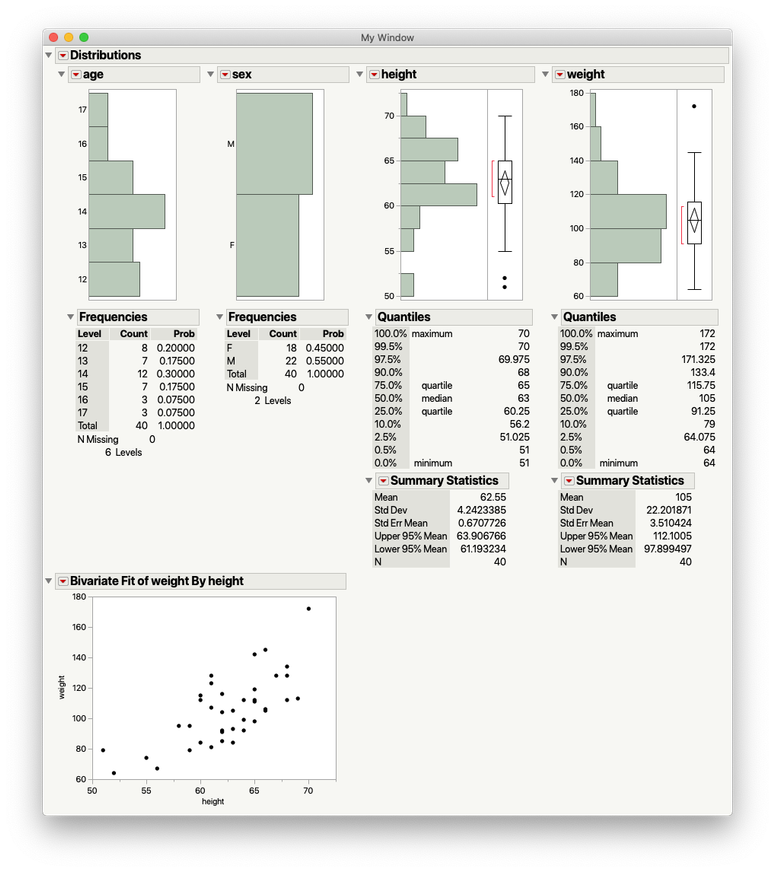
If you’re following along, you should see your report in the script area of the data table. If you run it, you should get something like this:
And that’s the little trick I used to turn a two-day analytical marathon into a 15-minute exercise in cutting and pasting. I spent a little time getting the data into a JMP data table that I could easily update. I then exported all the graphs I needed for that report into a single JSL window using Save Script to Script Window. I wrapped them in a new window (so that they were all in one place) and put that script in a Table Script in the data table. Was I working with JSL? Yes. Was I writing lots of code? No. Did I increase my efficiency? Definitely.
Now that we are getting into the actual coding, I need to stress this last point. Coding is about increasing your efficiency:
- How efficiently you can solve problems.
- How efficiently you can create reports (so you can get back to solving problems).
- How efficiently you can work with your data.
The code that we are going to create in this series is computer-generated or it’s simple. And that’s OK. It’s about efficient code not sexy code. When I was in college, one of my professors (a fellow musician) had a quote on the wall outside his office: Music that is simple is no better or worse than music that is complex. The same goes with code. I was reminded of this a while back by the person that taught me coding. So, remember: Code that is simple is no better or worse than code that is complex. All that matters is that it meets its intended purpose and increases the efficiency or productivity of those who use it.
Homework
For this week’s exercise, you’re going to look back at your problem statement. Think through the punch list you created and generate code using the workflows we’ve covered today. The code can be the actual code that you are going to use or prototype code that you think you’ll need to modify a little to answer your problem statement. Try to generate as many of the bits and pieces you think you’ll need using the red triangle menu and save them out as .jsl files. If you get stuck or can’t find a way to get JMP to generate the code you need, reach out for help, either in the Community or in the comments here. Don’t forget to search the Help, and don’t forget that you can search the Community, too!
Until next time, good luck and happy coding!
You must be a registered user to add a comment. If you've already registered, sign in. Otherwise, register and sign in.
- © 2026 JMP Statistical Discovery LLC. All Rights Reserved.
- Terms of Use
- Privacy Statement
- Contact Us

