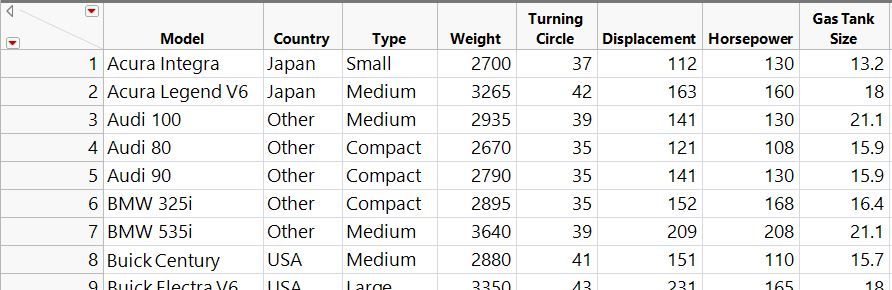
Importação e organização dos dados, Filtros e compartilhamento de resultados no JMP
Aprenda neste vídeo como importar dados para o JMP. Saiba como criar filtros, organizar seus dados e compartilhar seus resultados.
WesleySantosAprenda neste vídeo como importar dados para o JMP. Saiba como criar filtros, organizar seus dados e compartilhar seus resultados.
WesleySantosJed Campbell led a 45-minute session sharing essential tips and tricks for implementing robust quality management systems - including building a cultu...
Katie-Beth_VOnce you build your models in Python, you can bring them into JMP to visualize, understand, and communicate them. Below are two examples: Building two...
wendytsengAprenda neste vídeo como funciona o fluxo de Análise no JMP. Saiba como funciona o menu do JMP e como acessar o help.
WesleySantosThis six-part web series was designed to help you unlock the power of design of experiments (DOE). For those new to DOE, the series will help you unde...
scott_allenSee which folders are using the most space.
Craige_HalesDo you use JMP and Python? Are you using them independently? Python for certain things…JMP for others? Did you know that there are many ways they work...
wendytsengA group of JMP System Engineers demonstrate how easily JMP and Python can be integrated to handle everyday tasks like cleaning data, and more advanced...
Bill_Worley先日、日本のお客様向けに「JMPを用いた統計的仮説検定入門」という題目でWebセミナーを実施しました。セミナーの特性上、医療や医薬関係に従事している方が多く参加すると思っていたのですが、実際は半導体、電気・電子部品、素材などを開発している製造業の方々も多く参加されました。 このセミナーでは、JM...
Masukawa_NaoIs your data obscuring your data labels?
Byron_JMPIf you've wondered how to import your database using JMP's embedded Python environment, here are some examples that may help you get started. In the f...
Dahlia_WatkinsUse JSL to control a web browser.
Craige_HalesIn our first of a series relevant to anyone creating or testing software applications, we begin with "What is Software Testing?"
Ryan_LekivetzJMPでは、[グラフ] メニューに「三角図」というグラフを作成できるプラットフォームがあります。3つの成分をもつデータをグラフ化し、分布やばらつきを調べるのに有用なグラフではありますが、実験計画法における配合実験で用いると効果的なケースがあります。 「三角図」では、以下に示したようなグラフを描く...
Masukawa_Nao先週末、世界中がパリオリンピックの選手の活躍に注目していた中、アメリカでは7月の雇用統計が発表されました。今回の雇用統計では失業率が市場予想を上回り、景気後退のシグナルである「サームルール(Sahm Rule)」が点灯されたことが話題となりました。 サームルールとは、元FRBのクローディア・サー...
Masukawa_NaoBland-Altman分析は、2つの測定方法の一致性を評価するための統計的手法であり、主に医療や製造の分野で広く用いられています。以下に示すのは、Bland-Altaman分析を行う際に使用される「Bland-Altmanプロット」というグラフです。このプロットでは、縦軸に2つの測定値の差を、横軸...
Masukawa_NaoMaria Lanzerath, W.L. Gore's global statistics leader, advocates statistics, the scientific approach.
anne_milleyThis article demonstrates two ways to overlay histograms (and distribution curves) using Distribution and Graph Builder.
sseligman