- New to JMP? Join us Sept. 23-24 for the Early User Edition of Discovery Summit, tailor-made for new users. Register now for free!
- Use World Cup data to build models, explore spatial relationships, and create informative visualizations in JMP. Register. July 17, 2 pm US Eastern Time.
- Your voice matters! Tell us how you prefer to receive JMP updates, so we can tailor our communication to your needs. Take short survey.
- Subscribe to RSS Feed
- Mark Topic as New
- Mark Topic as Read
- Float this Topic for Current User
- Bookmark
- Subscribe
- Mute
- Printer Friendly Page
Discussions
Solve problems, and share tips and tricks with other JMP users.- JMP User Community
- :
- Discussions
- :
- Reproducing the Variability / Attribute Gauge Chart as a script

- Mark as New
- Bookmark
- Subscribe
- Mute
- Subscribe to RSS Feed
- Get Direct Link
- Report Inappropriate Content
Reproducing the Variability / Attribute Gauge Chart as a script
I’m in the midst of creating a Custom Starter for JMP like the one described here:
https://community.jmp.com/t5/JMP-Add-Ins/JMP-Custom-Starter-Six-Sigma-DMAIC-Menu-Add-in/ta-p/29384
My question is a bit involved, so please bear with me.
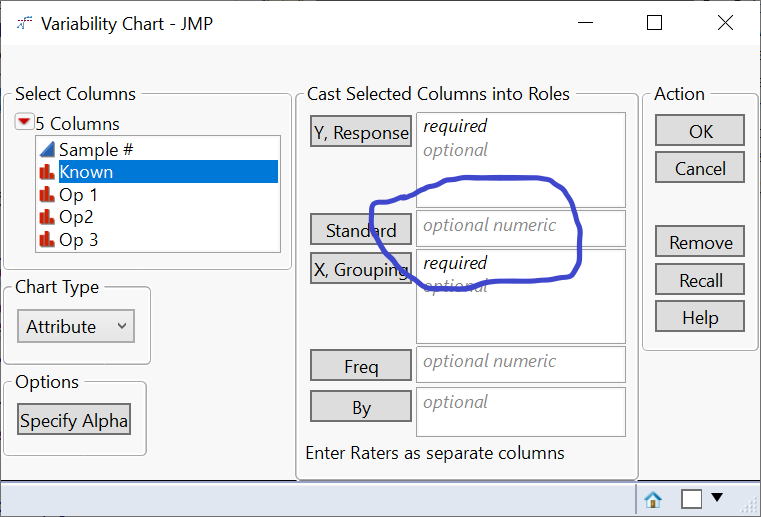
I have a problem re-creating one of the JMP standard menu items, namely the “Variability / Attribute Gauge Chart” found in the Analyze: Quality and Process menu systems. Here is an example script that I get when using this chart: Attribute Chart( Y( :Op 1, :Op2, :Op 3 ), X( :Sample # ), Standard( :Known ) ).
So, naturally, I’m thinking that the script to use in my Starter would be simply: “Attribute Chart()”.
Attached is a screenshot of the input screen that I get when running this script.

Notice that the Standard field expects a numeric column.
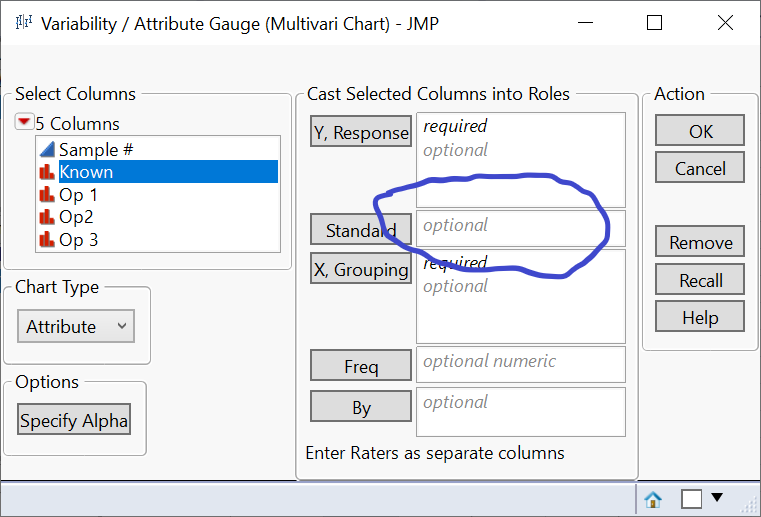
I've also attached a screenshot of the input menu that pops up when using the JMP Variability / Attribute Gauge Chart.

The title is different, but important to me is that I can use nominal variables in the Standard field.
My question is: What is the script syntax to get the same input menu that JMP displays? I’ve looked all over the Scripting Index, but no joy.
Thanks for your help.

- Mark as New
- Bookmark
- Subscribe
- Mute
- Subscribe to RSS Feed
- Get Direct Link
- Report Inappropriate Content
Re: Reproducing the Variability / Attribute Gauge Chart as a script
There is a JMP addin that I wrote a while back that has a pretty complete dialog box in it's JSL
.

Runs Test (Wald-Wolfowitz Test) and JSL Implementation of JMP Platform Dialog Box
You can also build dialog input boxes in the Application Builder
- Mark as New
- Bookmark
- Subscribe
- Mute
- Subscribe to RSS Feed
- Get Direct Link
- Report Inappropriate Content
Re: Reproducing the Variability / Attribute Gauge Chart as a script
Thank you, Jim,
I guess I followed your lead and made a custom dialog box for this particular use: Here is the script:
dt = Current Data Table();

dlg = Column Dialog(
	Col ID = Col List( "Raters", Min Col( 1 ) ),
	Text Box( "Enter Raters as seperate columns" ),
	Group = Col List( "Standard", Max Col( 1 ) ),
	Split = Col List( "Sample#", Min Col( 1 ), Max Col( 1 ) ),

);

my_Y = dlg["Col ID"];
my_X = dlg["Split"];
my_Standard = dlg["Group"];

Attribute Chart( Y( Eval( my_Y ) ), X( Eval( my_X ) ), Standard( Eval( my_Standard ) ) );
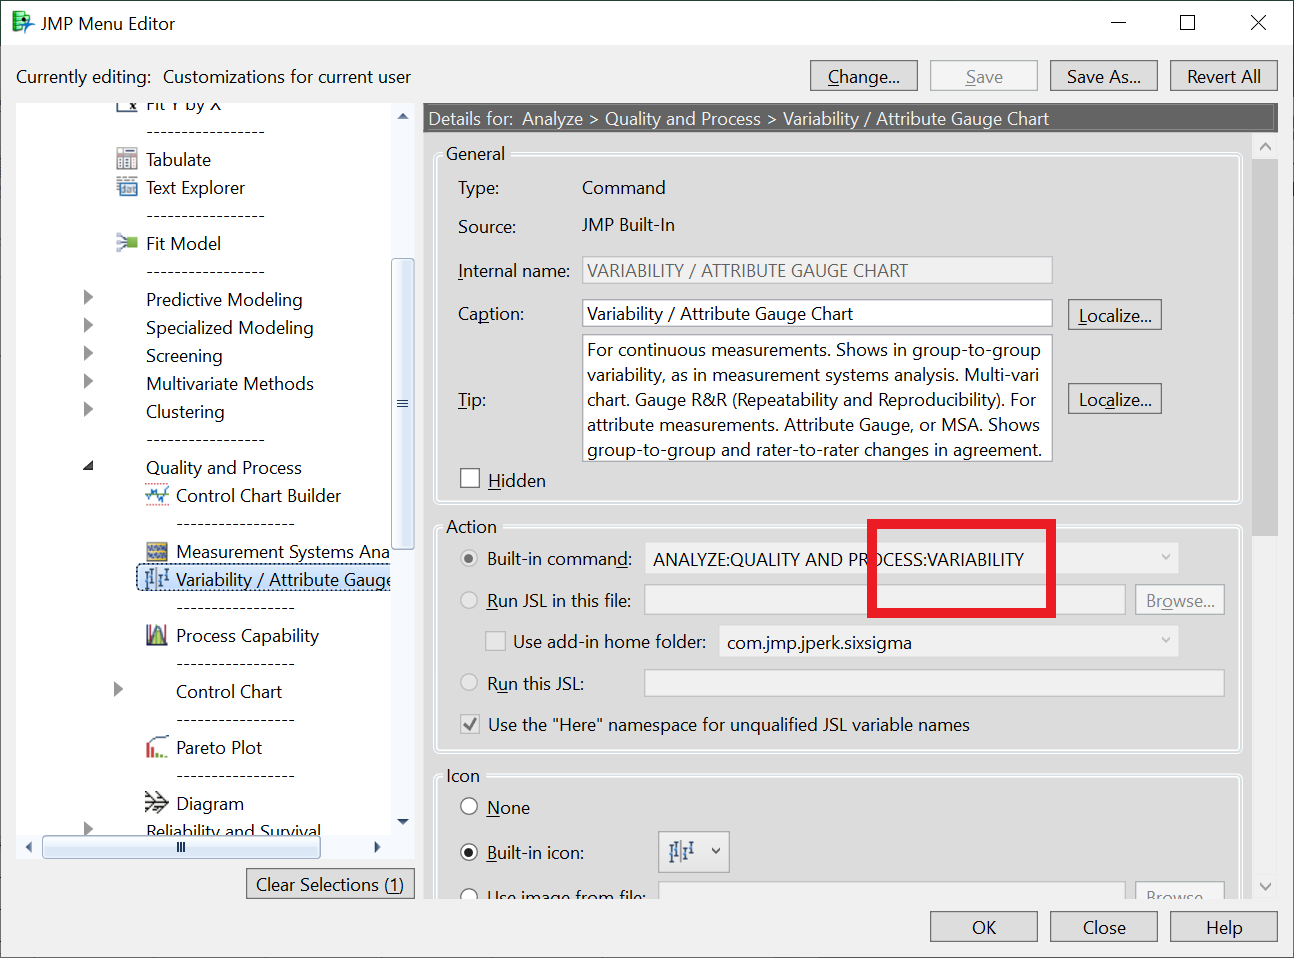
I am surprised that I needed to make this. I'm still wondering whether there is a platform command that someone knows. When I look at the JMP Menu Editor for this item, I would have guessed that the platform launch name would be "Variability()". See the attached for a screenshot. But, that doesn't work.

Kevin
- Mark as New
- Bookmark
- Subscribe
- Mute
- Subscribe to RSS Feed
- Get Direct Link
- Report Inappropriate Content
Re: Reproducing the Variability / Attribute Gauge Chart as a script
The correct syntax to bring up the Variability Chart is
Variability Chart( );
To see what the call is for any particular JMP Platform, just run the platform interactively, and then once the report is generated, just save the script for the report, and you can see the JSL required to run it
- Mark as New
- Bookmark
- Subscribe
- Mute
- Subscribe to RSS Feed
- Get Direct Link
- Report Inappropriate Content
Re: Reproducing the Variability / Attribute Gauge Chart as a script
Thanks again, Jim.
Yes, I know about "Variable Chart()". I probably didn't make clear what my hope was. The second paragraph of my initial post (along with the attached screenshots) is my best crack at it. Neither "Variable Chart()" nor "Attribute Chart()" reproduce the JMP menu for "Variability / Attribute Gauge Chart" in JMP's Analyze/Quality and Process menu tree, although both come close. As I mentioned, both of these commands require the "Standard" field to be numeric, whereas, the menu item "Variability / Attribute Chart" does not.
Kevin
- Mark as New
- Bookmark
- Subscribe
- Mute
- Subscribe to RSS Feed
- Get Direct Link
- Report Inappropriate Content
Re: Reproducing the Variability / Attribute Gauge Chart as a script
I do not know of any methodology other than building your own version of an input dialog screen, to take one of the Platform Input screens and modify it to your specific needs. I have suggested in the past, that it would be nice if the backdoors on the dialog input screens, as well as being able to append to the underlying program methods. But that really has not been surfaced to the JSL programmer. But, the creation of an input screen from scratch isn't that difficult.
I do suggest that you add your suggestions to the JMP Wish List.
- Mark as New
- Bookmark
- Subscribe
- Mute
- Subscribe to RSS Feed
- Get Direct Link
- Report Inappropriate Content
Re: Reproducing the Variability / Attribute Gauge Chart as a script
I ended up making a script to produce an input screen. It took several tries to get the syntax correct. I pasted it at the end of this message.
However, I did come across something interesting. The CustomStarterSpecFile.jmp from this link "https://community.jmp.com/t5/Discovery-Summit-2016/Creating-Your-Own-Dynamic-Workflow-With-JMP-Custo..." had an entry for Attibute Gauge with the command "Attribute Gauge Chart()" that doesn't work. Did this command work on earlier versions of JMP and is now broken? I suspect this is the command that I had hoped to use. So, maybe I should include this information on a Wish List post?
Here is my script:
dt = Current Data Table();

dlg = Column Dialog(
	Col ID = Col List( "Raters", Min Col( 1 ) ),
	Text Box( "Enter Raters as seperate columns" ),
	Group = Col List( "Standard", Max Col( 1 ) ),
	Split = Col List( "Sample#", Min Col( 1 ), Max Col( 1 ) ),

);

my_Y = dlg["Col ID"];
my_X = dlg["Split"];
my_Standard = dlg["Group"];

Attribute Chart( Y( Eval( my_Y ) ), X( Eval( my_X ) ), Standard( Eval( my_Standard ) ) );
Recommended Articles
- © 2026 JMP Statistical Discovery LLC. All Rights Reserved.
- Terms of Use
- Privacy Statement
- Contact Us