cancel
Showing results for 
Show  only  | Search instead for 
Did you mean: 
  • New to JMP? Join us Sept. 23-24 for the Early User Edition of Discovery Summit, tailor-made for new users. Register now for free!
  • Use World Cup data to build models, explore spatial relationships, and create informative visualizations in JMP. Register. July 17, 2 pm US Eastern Time.
  • Your voice matters! Tell us how you prefer to receive JMP updates, so we can tailor our communication to your needs. Take short survey.

JMP Wish List

We want to hear your ideas for improving JMP. Share them here.
Choose Language Hide Translation Bar

Graph Builder: Line - possibility to add breaks (💚)

☑ cool new feature
☑ could help many users!

☑ removes a „bug“

☐ nice to have

☐ nobody needs it


#myTop10_2024

What inspired this wish list request? 

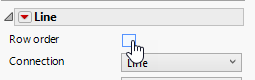
For Line Graphs in Graph Builder, there is a cool feature row order.
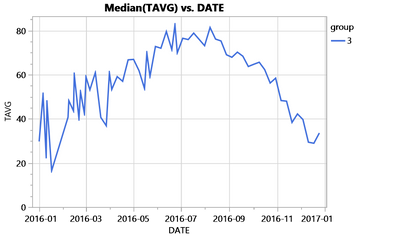
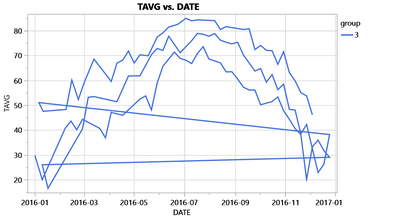
If it's selected, the line doesn't connect data points from left to right in the graph - but along the order in which they appear in the data table.
hogi_0-1689353265557.png


Instead of this graph:

hogi_1-1689353577247.png

the user gets this graph:

hogi_2-1689353594784.png

Much better ...


But unfortunately, there are those nasty jumps "back" to the next curve.

Of course, for simple graphs, you can use a column (here "Station") as an overlay to produce 3 separate curves, without the zigzag.
But already with slightly more complicated graphs like this one here: Graph Builder. Combine Smoother and Line - how? the user reaches the limits of current Graph Builder (v17, v18).


What is the improvement you would like to see? 


  1.  With sorted data in the data table, a step from right to left indicates a new curve.
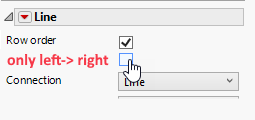
    So, with row order enabled, there could be an additional option to draw lines  "only left -> right".
    If this option is enabled, line for steps from higher to lower values will disappear -> the jump back-lines are gone : )
    hogi_4-1689354483794.png

  2. Fallback:  Rows with missing y value could be used to add a break in line graphs (even somewhere in the center of the graph - cool, right?)
    ... if there was an option: *)
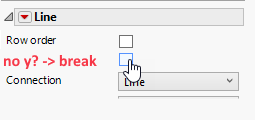
    hogi_5-1689355375351.png


Why is this idea important? 

a tiny change of the program - a  tremendous improvement for the users:

hogi_0-1725193366704.png


dt =Open( "$SAMPLE_DATA/Functional Data/Weekly Weather Data.jmp" );
dt << New Column( "group",Character,"Nominal",Formula( Substr( :STATION, 8, 1 ) ));
Graph Builder(
	Size( 523, 407 ),
	Summary Statistic( "Median" ),
	Graph Spacing( 4 ),
	Variables( X( :DATE ), Y( :TAVG ), Overlay( :group ), Color( :group ) ),
	Elements( Line( X, Y, Legend( 31 ), Row order( 1 ) ) ),
	Local Data Filter(
		Add Filter(
			columns( :STATION ),
			Where( :STATION == {"USW00003195", "USW00003868", "USW00003949"} ),
			Display( :STATION, N Items( 15 ) )
		)
	)
)


more wishes by  hogi_2-1702196401638.png

19 Comments
hogi
Level XIII

Option (2) is already available in Jmp:

hogi_0-1689434871660.png


Nevertheless, option (1) is still the preferred solution - can solve the issues of the backward jumps without the need to add auxiliary rows to the data table:

hogi_1-1689434936358.png

Craige_Hales
Super User

Interesting idea - if the X (or Y) order decreases, start a new line

hogi
Level XIII

Thanks @Craige_Hales 

With some luck, a developer will find the wish and likes it ...

hogi
Level XIII

@mia_stephens , easy to implement - could help a lot.

Till the new feature is available...
I just uploaded a new version of QuickSelect Toolbar .
It has a new function:

hogi_0-1725396348295.png

The idea:
Add dummy rows between every block of data - to add a break in the line plot.
It adds the new lines at the end of the table and uses a numeric column for sorting. Unfortunately, sorting a table is forbidden if reports are open (!)
-> will benefit from Sort data table + add rows + concatenate -- make it possible 

But I hope that 

hogi_2-1725396635602.png

will come first ...


BHarris
Level VII

In this case you can just create a new column (variable) for whatever's different between the lines, then drop that variable into Overlay, which breaks the lines correctly.

hogi
Level XIII

I never have free Overlay Dropzones ; )

This is a very common use case in our company.
Here is an example with Weather data - in this case, the Overlay is used for the Smoother:
 Graph Builder. Combine Smoother and Line - how? 

Status changed to: Acknowledged
 
hogi
Level XIII

Hi @Sarah-Sylvestre , "removing the zig-zag" lines cold be combined with other options to facilitate the formatting of plots in Graph Builder:

(view in My Videos)

hogi
Level XIII

#DACH2024

XanGregg
Staff

Another work-around, in case it's useful. Assigning the backwards line segments their own legend color item with width 0.

dt = Open( "$SAMPLE_DATA/Functional Data/Weekly Weather Data.jmp" );
dt << New Column( "group", Character, "Nominal", Formula( Substr( :STATION, 8, 1 ) ) );
dt << New Column( "cgroup", Character, "Nominal",
	Formula( If( Row() == 1 | Lag( :DATE ) > :DATE, "break", Substr( :STATION, 8, 1 ) ) )
);
Graph Builder(
	Size( 523, 448 ),
	Summary Statistic( "Median" ),
	Graph Spacing( 4 ),
	Variables( X( :DATE ), Y( :TAVG ), Overlay( :group, Overlay Encoding( "None" ) ), Color( :cgroup ) ),
	Elements( Line( X, Y, Legend( 31 ), Row order( 1 ) ) ),
	Local Data Filter(
		Add Filter( columns( :STATION ),
			Where(
				:STATION == {"USW00012924", "USW00013733", "USW00013877", "USW00014751", "USW00014922", "USW00024024"}
			),
			Display( :STATION, N Items( 15 ) )
		)
	),
	SendToReport(
		Dispatch( {}, "400", ScaleBox,
			{Legend Model( 31, Properties( 3, {Line Width( 0 )}, Item ID( "break", 1 ) ) )}
		),
		Dispatch( {}, "400", LegendBox, {Legend Position( {31, [0, 1, 2, -1, -4, -4, -4]} )} )
	)
);