 I have to tell you this other secret the JMP Masters know.OK. This is the last one, I promise.
If you're just tuning into the series, we have, in fact, run a little over time and will be vacating the conference room presently. Also, here's a brief recap of what you missed:
- I'm sharing five things I wish someone had told me on Day 1 using JMP ... well, that was the plan anyway.
- Thing 1: Always start with a graph.
- Thing 2: The 4-step JMP workflow everyone should know.
- Thing 3: Why the Analyze menu is set up the way it is.
- Thing 4: Don't underestimate the Distribution platform.
- Thing 5: Save. Your. Dang. Work!
- Thing 6: The 4-step JMP workflow for DOE.
And now on to...
The Other Secret of JMP Masters
JMP has this fantastic ability to run analyses on subgroups of data using By Columns. However, if you want to run several comparisons, you need to go through and select the test or method you want to do for each of the subgroups. Or do you? JMP has this capability called a broadcast key. On Mac OS, it's the Command Key (⌘). On PCs, it's Control (CTRL). Why is this little capability so important? Well, as I just mentioned, you can use it to run a test on subgroups in a report, but that's just the tip of the iceberg on what it can do. You can use it to standardize graphs, close all the Outline Items (those title boxes with the gray arrows next to them), export multiple fit equations into a single column in the data table, or even turn all the summary statistics for all the subgroups in a report into a single data table. In short, it increases your efficiency in all kinds of unexpected ways.
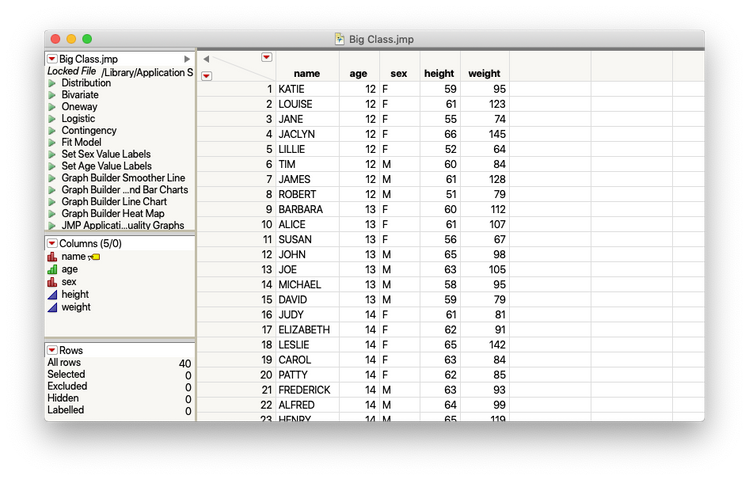
Let's have a little fun with an example. In JMP, open the Big Class.jmp data set (Help > Sample Data Library > Big Class.jmp). Then do the following:
- Select Analyze > Fit Y By X
- Put weight into "Y, Response"
- Put height into "X, Factor"
- Put age into "By"

-
Click OK
Following the JMP workflow, we would then look at the graphs created and form a question. For instance, "Is there a linear relationship between height and weight for different age groups?" We could also use, "How does the trend between height and weight differ over age groups?" We would then go to the Red Triangle menu (Answer Button) and select Fit Line.

We would have to do that for each of the ages to get the information that we need to answer the questions. Or, we can hold down the CTRL key (Command on the Mac) while we are selecting the Fit Line from the Red Triangle menu. The result is that the broadcast command will tell all the different graphs to attempt to fit a line. From there we can inspect the results, etc.

And that's it! The five(-ish) things I wish someone had sat down and told me when I started using JMP. I hope that these will be useful to some newbie out there. And, should there be some odd temporal inversion occurring and I'm actually reading this on the community a few years ago:
Thanks, me! And, I'm welcome.
You must be a registered user to add a comment. If you've already registered, sign in. Otherwise, register and sign in.