- Subscribe to RSS Feed
- Mark Topic as New
- Mark Topic as Read
- Float this Topic for Current User
- Bookmark
- Subscribe
- Mute
- Printer Friendly Page
Discussions
Solve problems, and share tips and tricks with other JMP users.- JMP User Community
- :
- Discussions
- :
- Re: why are no star points in custom design RSM
- Mark as New
- Bookmark
- Subscribe
- Mute
- Subscribe to RSS Feed
- Get Direct Link
- Report Inappropriate Content
why are no star points in custom design RSM
Hi JMP experts,
we internally discussed a lot, why there are no star points in the RSM design, which the custom designer computes.
What is the reason for that and is the classical design in this case better, than custom designer?
Thanks for help here.
Accepted Solutions
- Mark as New
- Bookmark
- Subscribe
- Mute
- Subscribe to RSS Feed
- Get Direct Link
- Report Inappropriate Content
Re: why are no star points in custom design RSM
By 'star points' I interpret your question as to the 'axial points' in a central composite design. To answer your question requires a bit of explanation as the thinking/thoughtware behind the classical design approach vs. the optimal design approach implemented in JMP. Without going too far back in the 'way back machine' in time, classical designs were originally created so as to create a design space that was optimal for a very specific case(s). Design properties such as balance, orthogonality, rotatability, parameter estimation, for a fixed number of runs, created the designs that are commonly lumped into the 'classic catalog of designs'. So 2 level full/fractional factorial designs, Box Behnken, central composite designs plus others were 'invented' if you will by people such as Fisher, Box, et. al.
Some constraints or design issues that arose over the years were things like, what if there are constraints wrt to the number of runs, specific effects that are required to be estimable, others, not so much, disallowed combinations for one reason or another, blocking issues, and on and on. So a different approach was needed...and through careful research and study, the field of 'optimal experimental design' techniques were created. In a nutshell, when any of the issues noted above rear their ugly heads...the classic designs just don't fit the constraints or situation. The optimal approach uses a model driven mathematical approach to find the set of treatment combinations of the factors, incorporating any constraints, in such a way that an 'optimality criteria' (D, A, I, G, etc.) is maximized.
Which is better is very much dependent on your criteria for 'better'. At the end of the day, to me the 'better' design path is the one that helps me solve the practical problem at hand...or as my first DOE instructor said, "Provides the required information for the least expenditure of resources." In some cases that might be a classic design...but my experience over the years was because of the frequency with which issues/constraints the optimal path was the path that provided "The required information for the least expenditure of resources."
A good book to read to explore optimal DOE is "Optimal Design of Experiments: A Case Study Approach" by Goos and Jones.
- Mark as New
- Bookmark
- Subscribe
- Mute
- Subscribe to RSS Feed
- Get Direct Link
- Report Inappropriate Content
Re: why are no star points in custom design RSM
Thanks a lot for your deep answer!! That helps
- Mark as New
- Bookmark
- Subscribe
- Mute
- Subscribe to RSS Feed
- Get Direct Link
- Report Inappropriate Content
Re: why are no star points in custom design RSM
Hi @SimonFuchs,
It's difficult to answer on a very general and broad case, as depending on the number of factors and constraints/specifications, the Custom Design platform may sometimes provide a different design than classical one (like Central Composite Design), but it may also sometimes provide the same design as a classical CCD.
I did a small example with 3 continuous factors and creating 2 designs, one with the "Classical", "Response Surface Design" platform (chosing CCD and axial values of "1", "On Face"), and one with the "Custom Design" platform, and end up with the same CCD designs with 16 runs.
- Script Custom Design :
DOE(
	Custom Design,
	{Add Response( Maximize, "Y", ., ., . ),
	Add Factor( Continuous, -1, 1, "X1", 0 ),
	Add Factor( Continuous, -1, 1, "X2", 0 ),
	Add Factor( Continuous, -1, 1, "X3", 0 ), Set Random Seed( 275411 ),
	Number of Starts( 43773 ), Add Term( {1, 0} ), Add Term( {1, 1} ),
	Add Term( {2, 1} ), Add Term( {3, 1} ), Add Term( {1, 2} ),
	Add Term( {1, 1}, {2, 1} ), Add Term( {2, 2} ), Add Term( {1, 1}, {3, 1} ),
	Add Term( {2, 1}, {3, 1} ), Add Term( {3, 2} ), Set Sample Size( 16 ),
	Optimality Criterion( "Make I-Optimal Design" ), Simulate Responses( 0 ),
	Save X Matrix( 0 ), Make Design}
)
- Script Central Composite Design
DOE(
	Response Surface Design,
	{Add Response( Maximize, "Y", ., ., . ),
	Change Factor Settings( 1, -1, 1, "X1" ),
	Change Factor Settings( 2, -1, 1, "X2" ),
	Add Factor( Continuous, -1, 1, "X3", 0 ), Set Random Seed( 275411 ),
	Make Design( 1 ), Set Axial Choice( 3 ), Center Points( 2 ),
	Simulate Responses( 0 ), Save X Matrix( 0 ), Set Run Order( Randomize ),
	Make Table}
)
You can compare these two designs, they should be identical.
Could you provide more details to your question ? Do you have a concrete case to illustrate it ?
Maybe you question is more related to the position of star points (on face, rotatable, orthogonal) and its influence on the model (since Custom Design will only create star points "on face" as it is restricted by the range of the factors and can't expand over it) ?
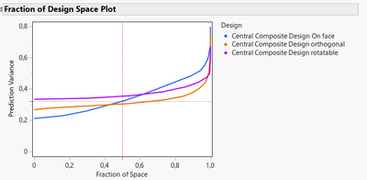
Here is a short Power comparison for the three design types of star points locations: On face (-1/1), Orthogonal (-1,29/1,29) and Rotatable (-1,68/1,68) :
And variance comparison :
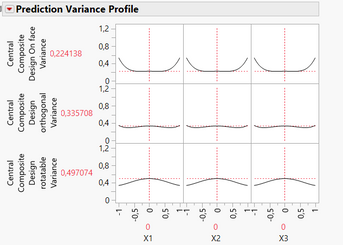
As you can see, the farthest the star points are from the centre of the experimental space :
- The higher the power for main effects and quadratic effects, but the lower the power for the intercept,
- The higher the variance in the centre of the experimental space, but the lower the variances at the border of the experimental space.
I hope you'll find this first answer useful, and depending on your future questions and replies, it may be easier for other members to join the conversation and help you.
"It is not unusual for a well-designed experiment to analyze itself" (Box, Hunter and Hunter)
- Mark as New
- Bookmark
- Subscribe
- Mute
- Subscribe to RSS Feed
- Get Direct Link
- Report Inappropriate Content
Re: why are no star points in custom design RSM
Hi Victor,
thanks a lot for your deep answer. You clear summary in two points in the end is really nice take home question.
In have still a question. I compared both provided designs, and they differ, since the custom design has 16 runs and the box benhken only 14. so there are different factor combinations in both designs. which makes it a bit difficult for me to understand the backgrounds of the customdesign and how JMP comes up with the best design for my purpose, so fasr I believed that the custom design is the best for all RSM experiments.
- Mark as New
- Bookmark
- Subscribe
- Mute
- Subscribe to RSS Feed
- Get Direct Link
- Report Inappropriate Content
Re: why are no star points in custom design RSM
Here are my thoughts regarding RSM, please excuse my ramblings:
The whole idea behind these types of designs is to map (e.g., contour map) the response in the design space so you can select the levels of the factors that optimize the response. The questions you must ask yourself is: Are you at the optimal design space (have you identified the significant factors and an envelope of levels for those factors to operate in, typically through screening designs) and is this space consistent over changing conditions (e.g., noise, which means you will need to have studied factor effects in the face of noise)? Statistical significance is no longer important (it has already been established). If, however, your design space depends on changing conditions, the map will not be useful. It would be like having a map of Philadelphia when you are in Boulder. While there is much emphasis on the "best design" based on optimality criteria, alas, many experimenters do not have enough information to choose those criteria á priori (and the old adage holds true: Garbage in, garbage out). In addition, these designs do not emphasize strategies to understand noise appropriately. The focus is solely on the design structure (Think of any experiment you have ever contemplated. Then think of the number of factors that are in the study vs. not in the study. You are always experimenting on a fraction of the true space. It is even further flawed reasoning to leave out factors you don't think matter without ever getting data to support such an hypothesis) I am certainly biased by the teachings of G.E.P. Box. His idea of response surface methodology is to conduct sequential designs to ultimately map the space, rather than try and do this in one experiment. This also gives the huge advantage of being able to assess stability of the design space over changing conditions. Just another note for design selection, don't turn off engineering. Visualize the space you are studying, does the design fill that space appropriately? Do you need to emphasize areas of the space? If so, why?
Just a note, not to be argumentative, blocking and many strategies to handle noise (cross-product arrays, split-plots, BIB, etc.) were invented long before optimality criteria came into favor.
- Mark as New
- Bookmark
- Subscribe
- Mute
- Subscribe to RSS Feed
- Get Direct Link
- Report Inappropriate Content
Re: why are no star points in custom design RSM
Hi @SimonFuchs,
Box Behnken designs are very different from Central Composite Designs or Response Surface Custom/optimal designs.
This classical design is used in litterature as one of the design having the "best precision", as more power is available for quadratic power, and also because this design has uniform precision in the experimental space, often for a lower number of runs than for the Central Composite Design. It should be centered in the optimal experimental space, or very close from it. More infos on Box-Benhken : The Open Educator - 4. Box-Behnken Response Surface Methodology
Because of these characteristics and differences, the repartition of points is different (different combinations of factors as you mention):
Box-Behnken (15 runs by default for 3 factors in JMP, no points in the corners) :
Optimal RSM design (Custom design, 16 runs by default for 3 factors) :
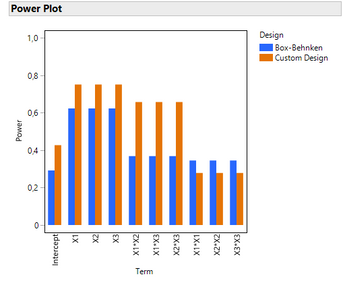
And here is the comparison for power (detection of effects) :
Optimal RSM design has higher power for main effects, 2-factors interactions. Box-Behnken has slightly higher power for quadratic effects.
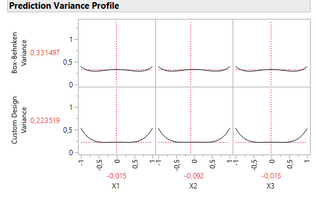
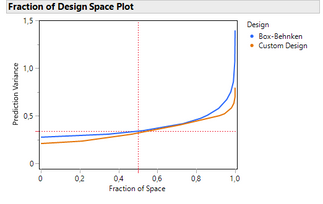
Concerning the prediction variance profile, the Custom Design does a slightly better job than the Box-Behnken.
I would highly recomment the use of Custom design over classical designs (like Box-Behnken, Central Composite, ...), as it enables to have efficient designs that can also handle a lot of constraints or different types of factors (categorical for example, that is not handled in classical Response Surface designs), and support iterative methodology (through design augmentation) that can help you during all the phases of your research (screening -> exploration -> optimization).
"It is not unusual for a well-designed experiment to analyze itself" (Box, Hunter and Hunter)
- Mark as New
- Bookmark
- Subscribe
- Mute
- Subscribe to RSS Feed
- Get Direct Link
- Report Inappropriate Content
Re: why are no star points in custom design RSM
To be clear, the primary reason the Box-Behnken design was "invented" was because the extreme vertices (corners of the space or star points) were not possible combinations of levels to run (essentially a constraint). Again, it is important to visualize the space you are experimenting in.
Recommended Articles
- © 2026 JMP Statistical Discovery LLC. All Rights Reserved.
- Terms of Use
- Privacy Statement
- Contact Us


