- Instantly extract effect sizes, F-ratios, and FDR-adjusted p-values from your models with the Calculate Effects Sizes extension, available now in the JMP Marketplace!
- New to JMP? Join us Sept. 23-24 for the Early User Edition of Discovery Summit, tailor-made for new users. Register now for free!
- Your voice matters! Tell us how you prefer to receive JMP updates, so we can tailor our communication to your needs. Take short survey.
- Subscribe to RSS Feed
- Mark Topic as New
- Mark Topic as Read
- Float this Topic for Current User
- Bookmark
- Subscribe
- Mute
- Printer Friendly Page
Discussions
Solve problems, and share tips and tricks with other JMP users.- JMP User Community
- :
- Discussions
- :
- Re: overlay plot customize color

- Mark as New
- Bookmark
- Subscribe
- Mute
- Subscribe to RSS Feed
- Get Direct Link
- Report Inappropriate Content
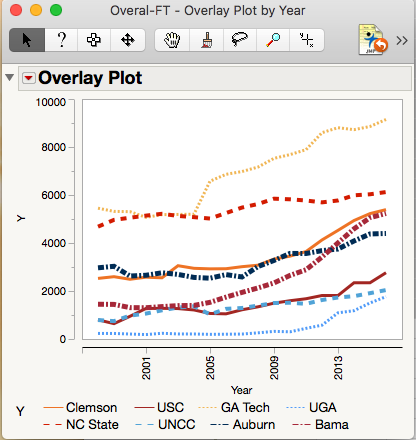
overlay plot customize color
I use overlay plot often to plot the change overtime. Usually I customize the color and line style of each variable (see attached). However, when I add more variables to the plot by "relaunch analysis" command, all the cusotmization is gone and I have to redo everything--which could be a pain if I have many variables. Is there a way to save the customization, and when I relaunch analysis, I just have to recustomize the newly added variables? Thank you a million!
Accepted Solutions

- Mark as New
- Bookmark
- Subscribe
- Mute
- Subscribe to RSS Feed
- Get Direct Link
- Report Inappropriate Content
Re: overlay plot customize color
Oh, sorry. I was off in Graph Builder land while you were using the Overlay Plot platform. Whoops!
Same general principle applies, however. After you save your script, edit the script to include the additional variable.
For example, if I start with 3 response variables Y1, Y2, and Y3 and totally customize my chart, I could get the following script:
Overlay Plot(
	X( :X ),
	Y( :Y1, :Y2, :Y3 ),
	Function Plot( 1 ),
	:Y1(
		Connect Color( 35 ),
		Overlay Marker Color( 35 ),
		Overlay Marker( 8 ),
		Line Width( "Thin" )
	),
	:Y2(
		Connect Color( 68 ),
		Overlay Marker Color( 68 ),
		Overlay Marker( 1 ),
		Line Style( 2 ),
		Line Width( "Thin" )
	),
	:Y3(
		Connect Color( 37 ),
		Overlay Marker Color( 37 ),
		Line Style( 1 ),
		Line Width( "Thin" )
	),
	SendToReport(
		Dispatch(
			{},
			"Overlay Plot Graph",
			FrameBox,
			{DispatchSeg( Marker Seg( 1 ), {Color( "Medium Light Red" )} ),
			DispatchSeg( Marker Seg( 2 ), {Color( "Light Green" )} ),
			DispatchSeg( Marker Seg( 3 ), {Color( "Medium Light Blue" )} ),
			DispatchSeg(
				CustomStreamSeg( 1 ),
				{Line Color( "Medium Dark Red" ), Line Style( "Dotted" )}
			)}
		)
	)
);
Now, let's say I have a new response Y4. I can just edit 1 line in the script to add this variable:
Y( :Y1, :Y2, :Y3, :Y4 ),Now, I get the same plot with my customizations for the Y1 through Y3, but I also have my new column as an additional line on the overlay plot.
- Mark as New
- Bookmark
- Subscribe
- Mute
- Subscribe to RSS Feed
- Get Direct Link
- Report Inappropriate Content
Re: overlay plot customize color
Hi @xiaoyaj0,
If you save the script and launch from there, it should retain the line and point customization you did previously, and assign default values to the new levels that you added.
For example, I have my overlay variable :Group with 3 levels (A, B, C). The plot looks like this:

I save the script to my data table.
Now, I add a fourth level to :Group, "D". Of course, this resets everything in Graph Builder I have currently as you describe. However, if I run the script, I get my prior customization, plus a solid purple line for the new group "D".

- Mark as New
- Bookmark
- Subscribe
- Mute
- Subscribe to RSS Feed
- Get Direct Link
- Report Inappropriate Content
Re: overlay plot customize color
Hi, thank you for replying me. This sounds fascinating. However, I am still a bit lost--how did you go from having the colors reset to getting your prior customization? Did you add one more level without relaunching the script? I had my first customization saved as script to the data table as well, but when I had to add one more level, I had to relaunch script and that is when the prior customization was lost.
Sorry if I missed something! Looking forward to hearing from you!
- Mark as New
- Bookmark
- Subscribe
- Mute
- Subscribe to RSS Feed
- Get Direct Link
- Report Inappropriate Content
Re: overlay plot customize color
What I'm suggesting is that instead of relaunching the analysis, save what you have as a script. When your data is updated, run your script to pick up where you left off last. Graph Builder is one of the platforms that dynamically updates in response to data table changes, so there's really no need to relaunch the analysis anyway from what I can see.
- Mark as New
- Bookmark
- Subscribe
- Mute
- Subscribe to RSS Feed
- Get Direct Link
- Report Inappropriate Content
Re: overlay plot customize color
I see what you mean now. But mine is a different situation. Mine was not a new level to the same variable, but a new variable( in this case it was a new university to the university enrollment vs. year overlay plot). Do you know if there is a way I can save the customization? Thank you a million!
@cwillden wrote:What I'm suggesting is that instead of relaunching the analysis, save what you have as a script. When your data is updated, run your script to pick up where you left off last. Graph Builder is one of the platforms that dynamically updates in response to data table changes, so there's really no need to relaunch the analysis anyway from what I can see.
- Mark as New
- Bookmark
- Subscribe
- Mute
- Subscribe to RSS Feed
- Get Direct Link
- Report Inappropriate Content
Re: overlay plot customize color
Oh, sorry. I was off in Graph Builder land while you were using the Overlay Plot platform. Whoops!
Same general principle applies, however. After you save your script, edit the script to include the additional variable.
For example, if I start with 3 response variables Y1, Y2, and Y3 and totally customize my chart, I could get the following script:
Overlay Plot(
	X( :X ),
	Y( :Y1, :Y2, :Y3 ),
	Function Plot( 1 ),
	:Y1(
		Connect Color( 35 ),
		Overlay Marker Color( 35 ),
		Overlay Marker( 8 ),
		Line Width( "Thin" )
	),
	:Y2(
		Connect Color( 68 ),
		Overlay Marker Color( 68 ),
		Overlay Marker( 1 ),
		Line Style( 2 ),
		Line Width( "Thin" )
	),
	:Y3(
		Connect Color( 37 ),
		Overlay Marker Color( 37 ),
		Line Style( 1 ),
		Line Width( "Thin" )
	),
	SendToReport(
		Dispatch(
			{},
			"Overlay Plot Graph",
			FrameBox,
			{DispatchSeg( Marker Seg( 1 ), {Color( "Medium Light Red" )} ),
			DispatchSeg( Marker Seg( 2 ), {Color( "Light Green" )} ),
			DispatchSeg( Marker Seg( 3 ), {Color( "Medium Light Blue" )} ),
			DispatchSeg(
				CustomStreamSeg( 1 ),
				{Line Color( "Medium Dark Red" ), Line Style( "Dotted" )}
			)}
		)
	)
);
Now, let's say I have a new response Y4. I can just edit 1 line in the script to add this variable:
Y( :Y1, :Y2, :Y3, :Y4 ),Now, I get the same plot with my customizations for the Y1 through Y3, but I also have my new column as an additional line on the overlay plot.
- Mark as New
- Bookmark
- Subscribe
- Mute
- Subscribe to RSS Feed
- Get Direct Link
- Report Inappropriate Content
Re: overlay plot customize color
WOW, that is amazing!I just tried it and got exactly the same effect as you just described! Thank you so very much! I can see how easy manipulation of the script could help so much with everything, esp. when I need repeated processes. Could you recommend some resources where I could learn some easy scripting? To be honest, I never did any scripting; up to now, I have only used the point click around JMP. Thank you a million!
- Mark as New
- Bookmark
- Subscribe
- Mute
- Subscribe to RSS Feed
- Get Direct Link
- Report Inappropriate Content
Re: overlay plot customize color
I started with Jump into JMP Scripting by Wendy Murphrey and Rosemary Lucas. Excellent book, but JSL has evolved quite a bit since that book was published. The book will at least get you to the point where you have a feel for the language. After that, I used the Scripting Guide from the Help menu (Help > Books > Scripting Guide). That is an incredible resource, as well as the Scripting Index in the Help menu.
- Mark as New
- Bookmark
- Subscribe
- Mute
- Subscribe to RSS Feed
- Get Direct Link
- Report Inappropriate Content
Re: overlay plot customize color
Thank you! I will check them out!
- Mark as New
- Bookmark
- Subscribe
- Mute
- Subscribe to RSS Feed
- Get Direct Link
- Report Inappropriate Content
Re: overlay plot customize color
My reply got posted repeatedly. I just deleted the content here in the second one.
Recommended Articles
- © 2026 JMP Statistical Discovery LLC. All Rights Reserved.
- Terms of Use
- Privacy Statement
- Contact Us