Turn on suggestions
Auto-suggest helps you quickly narrow down your search results by suggesting possible matches as you type.
- Don’t miss your chance to experience Discovery Summit Europe at our best available rate! Early bird registration through 31 Oct.
- Graph Builder Toolbar streamlines interactive graphing. Creates shortcuts on Report and GraphBuilder Helpers toolbars. Download and install the extension.
Options
- Subscribe to RSS Feed
- Mark Topic as New
- Mark Topic as Read
- Float this Topic for Current User
- Bookmark
- Subscribe
- Mute
- Printer Friendly Page
Discussions
Solve problems, and share tips and tricks with other JMP users.- User Community
- :
- Discussions
- :
- change the Grapg Builder label value to 2 or 1 decimal ?

Level II
- Mark as New
- Bookmark
- Subscribe
- Mute
- Subscribe to RSS Feed
- Get Direct Link
- Report Inappropriate Content
change the Grapg Builder label value to 2 or 1 decimal ?
Created:
Apr 10, 2014 05:05 AM
| Last Modified: Oct 18, 2016 1:37 PM
(6468 views)
Hi,
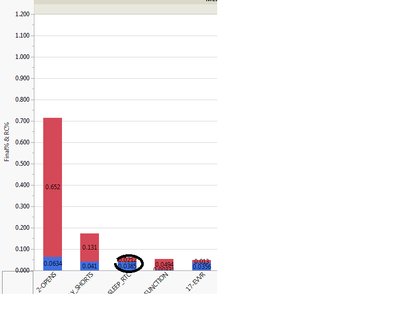
for Graph builder : see below the picture, possible to change the label value to 2 or 1 decimal ?
thanks
Hu Pin
5 REPLIES 5

Level I
- Mark as New
- Bookmark
- Subscribe
- Mute
- Subscribe to RSS Feed
- Get Direct Link
- Report Inappropriate Content
Re: change the Grapg Builder label value to 2 or 1 decimal ?
Try changing the value in the dataset. That is, go to the table, right click on the column that you are graphing, select "Column Info", and modify the Format.
Cheers.

Level II
- Mark as New
- Bookmark
- Subscribe
- Mute
- Subscribe to RSS Feed
- Get Direct Link
- Report Inappropriate Content
Re: change the Grapg Builder label value to 2 or 1 decimal ?
Its possible to make changes for the Graph, just play aroung with the Axis seettings.

Level I
- Mark as New
- Bookmark
- Subscribe
- Mute
- Subscribe to RSS Feed
- Get Direct Link
- Report Inappropriate Content
Re: change the Grapg Builder label value to 2 or 1 decimal ?
Thanks, I've been searching how to fix the decimal for label on the graph for few days... but now I got the solution. :)

Level XIII
- Mark as New
- Bookmark
- Subscribe
- Mute
- Subscribe to RSS Feed
- Get Direct Link
- Report Inappropriate Content
Re: change the Grapg Builder label value to 2 or 1 decimal ?
To change the format of the labels, you can use Label format in the settings of the Bar Plot:

Level XIII
- Mark as New
- Bookmark
- Subscribe
- Mute
- Subscribe to RSS Feed
- Get Direct Link
- Report Inappropriate Content
Re: change the Grapg Builder label value to 2 or 1 decimal ?
To change the position and orientation via the GUI, please vote here:
Graphbuilder: option to rotate - and position - labels
Recommended Articles
- © 2026 JMP Statistical Discovery LLC. All Rights Reserved.
- Terms of Use
- Privacy Statement
- Contact Us