- New to JMP? Let the Data Analysis Director guide you through selecting an analysis task, an analysis goal, and a data type. Available now in the JMP Marketplace!
- See how to install JMP Marketplace extensions to customize and enhance JMP.
- Subscribe to RSS Feed
- Mark Topic as New
- Mark Topic as Read
- Float this Topic for Current User
- Bookmark
- Subscribe
- Mute
- Printer Friendly Page
Discussions
Solve problems, and share tips and tricks with other JMP users.- JMP User Community
- :
- Discussions
- :
- Two-Group Discriminant Analysis - Plot Looks Weird?

- Mark as New
- Bookmark
- Subscribe
- Mute
- Subscribe to RSS Feed
- Get Direct Link
- Report Inappropriate Content
Two-Group Discriminant Analysis - Plot Looks Weird?
Hello,
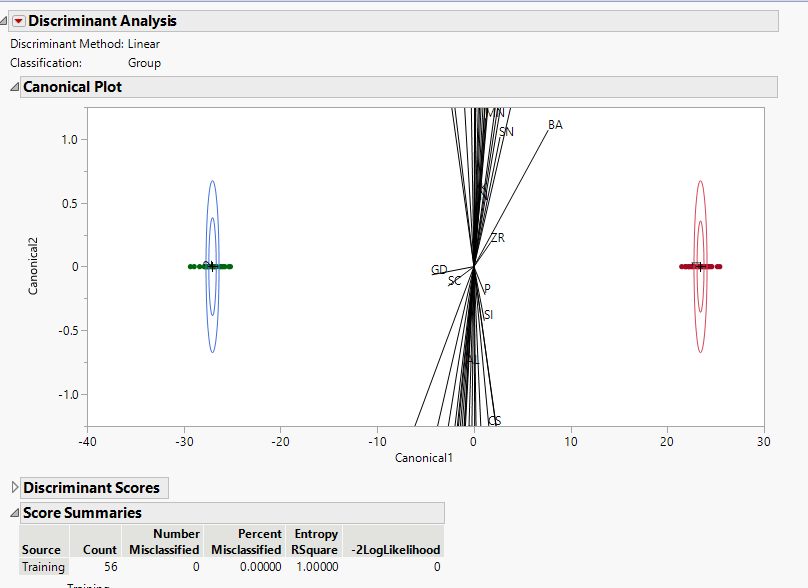
I am trying to perform a two-group discriminant analysis but I think my plot looks funny. It is suspicious to me that all of my samples within each group are horizontally spread across the same Canonical1 variable. Is this normal? Thank you for your help.
Accepted Solutions

- Mark as New
- Bookmark
- Subscribe
- Mute
- Subscribe to RSS Feed
- Get Direct Link
- Report Inappropriate Content
Re: Two-Group Discriminant Analysis - Plot Looks Weird?
This is normal, because you have only two groups. Refer to Canonical Structure , if you have K groups, K-1 canonical variables are obtained. In the situation of two groups, there is just 1 canonical variable. You can see how the coordinates are defined by going to the platform red triangle menu, select Canonical Options > Save Canonical Scores, to save the values to the original data table. In addition, for your example, the two groups are well separable.
Recommended Articles
- © 2026 JMP Statistical Discovery LLC. All Rights Reserved.
- Terms of Use
- Privacy Statement
- Contact Us