cancel
Showing results for 
Show  only  | Search instead for 
Did you mean: 

Discussions

Solve problems, and share tips and tricks with other JMP users.
%3CLINGO-SUB%20id%3D%22lingo-sub-391233%22%20slang%3D%22en-US%22%20mode%3D%22NONE%22%3E%ED%86%B5%EA%B3%84%20%EA%B2%B0%EA%B3%BC%20%ED%91%9C%EC%8B%9C%20%EB%B0%A9%EB%B2%95%20%26amp%3B%20amp%3B%20%EA%B7%B8%EB%9E%98%ED%94%84%EC%97%90%20%EC%83%89%EC%9D%84%20%EB%84%A3%EB%8B%A4%3C%2FLINGO-SUB%3E%3CLINGO-BODY%20id%3D%22lingo-body-391233%22%20slang%3D%22en-US%22%20mode%3D%22NONE%22%3E%3CP%3E%EC%95%88%EB%85%95%ED%95%98%EC%84%B8%EC%9A%94%20%EC%A0%80%EB%8A%94%20JMP%20%EC%B4%88%EB%B3%B4%EC%9E%90%EC%9E%85%EB%8B%88%EB%8B%A4.%3C%2FP%3E%3CP%3E1.%20%ED%86%B5%EA%B3%84%20%EA%B2%B0%EA%B3%BC%EB%A5%BC%20%EC%95%84%EB%9E%98%20%EA%B7%B8%EB%9E%98%ED%94%84%EC%99%80%20%EA%B0%99%EC%9D%B4%20%ED%91%9C%EC%8B%9C%ED%95%98%EB%8A%94%20%EB%B0%A9%EB%B2%95%EC%9D%84%20%EC%9D%B4%ED%95%B4%ED%95%98%EA%B3%A0%20%EC%8B%B6%EC%8A%B5%EB%8B%88%EB%8B%A4.%3C%2FP%3E%3CP%3E%EC%95%84%EB%9E%98%EC%97%90%EC%84%9C%20%EB%A7%8E%EC%9D%80%20%ED%95%AD%EB%AA%A9%EC%9D%98%20%EC%83%81%EC%9E%90%20%EA%B7%B8%EB%A6%BC%EC%9D%84%20%EB%B3%BC%20%EC%88%98%20%EC%9E%88%EC%8A%B5%EB%8B%88%EB%8B%A4.%20%EA%B0%81%20%ED%95%AD%EB%AA%A9%EC%97%90%EB%8A%94%20%EC%9E%90%EC%B2%B4%20%EC%88%98%EB%9F%89%2C%20%ED%8F%89%EA%B7%A0%2C%20%ED%91%9C%EC%A4%80%2C%20cpk%20%EA%B0%92%EC%9D%B4%20%EC%9E%88%EC%8A%B5%EB%8B%88%EB%8B%A4.%3C%2FP%3E%3CP%3E%EC%9D%B4%EB%9F%B0%20%EA%B7%B8%EB%A6%BC%EC%9D%84%20%EC%96%B4%EB%96%BB%EA%B2%8C%20%EA%B7%B8%EB%A6%B4%20%EC%88%98%20%EC%9E%88%EC%8A%B5%EB%8B%88%EA%B9%8C%3F%20%EB%82%98%EB%8A%94%20%EA%B7%B8%EB%9E%98%ED%94%84%20%EB%B9%8C%EB%8D%94%EB%A1%9C%20%EA%B7%B8%EB%A6%AC%EB%8A%94%20%EB%B0%A9%EB%B2%95%20%EB%A7%8C%20%EC%95%8C%EA%B3%A0%20%EC%9E%88%EC%8A%B5%EB%8B%88%EB%8B%A4.%20(%EC%97%AC%EA%B8%B0%EC%97%90%20%EB%8C%80%ED%95%9C%20%EA%B8%B0%EB%8A%A5%EC%9D%84%20%EC%B0%BE%EC%9D%84%20%EC%88%98%20%EC%97%86%EC%8A%B5%EB%8B%88%EB%8B%A4)%3C%2FP%3E%3CP%3E2.%20%EC%95%84%EB%9E%98%20%EA%B7%B8%EB%A6%BC%EA%B3%BC%20%EA%B0%99%EC%9D%80%20%EC%83%89%EC%83%81%EC%9D%84%20%EC%96%B4%EB%96%BB%EA%B2%8C%20%EB%84%A3%EC%9D%84%20%EC%88%98%20%EC%9E%88%EC%8A%B5%EB%8B%88%EA%B9%8C%3F%20%EA%B7%B8%EB%9E%98%ED%94%84%20%EB%B9%8C%EB%8D%94%20%EA%B8%B0%EB%8A%A5%EC%97%90%EC%84%9C%EB%8F%84%20%EC%B0%BE%EC%9D%84%20%EC%88%98%20%EC%97%86%EC%8A%B5%EB%8B%88%EB%8B%A4.%3C%2FP%3E%3CP%3E%3CSPAN%20class%3D%22lia-inline-image-display-wrapper%20lia-image-align-inline%22%20image-alt%3D%22Dan2_0-1623073808033.png%22%20style%3D%22width%3A%20734px%3B%22%3E%3Cspan%20class%3D%22lia-inline-image-display-wrapper%22%20image-alt%3D%22Dan2_0-1623073808033.png%22%20style%3D%22width%3A%20734px%3B%22%3E%3Cimg%20src%3D%22https%3A%2F%2Fcommunity.jmp.com%2Ft5%2Fimage%2Fserverpage%2Fimage-id%2F33329i591EC2D5CF61EA8D%2Fimage-dimensions%2F734x276%3Fv%3Dv2%22%20width%3D%22734%22%20height%3D%22276%22%20role%3D%22button%22%20title%3D%22Dan2_0-1623073808033.png%22%20alt%3D%22Dan2_0-1623073808033.png%22%20%2F%3E%3C%2Fspan%3E%3C%2FSPAN%3E%3C%2FP%3E%3CP%3E%26nbsp%3B%3C%2FP%3E%3CP%3E%26nbsp%3B%3C%2FP%3E%3C%2FLINGO-BODY%3E%3CLINGO-LABS%20id%3D%22lingo-labs-391233%22%20slang%3D%22en-US%22%20mode%3D%22NONE%22%3E%3CLINGO-LABEL%3E%ED%95%B4%EC%84%9D%ED%95%99%3C%2FLINGO-LABEL%3E%3CLINGO-LABEL%3E%EC%A0%9C%EB%8F%84%EB%B2%95%3C%2FLINGO-LABEL%3E%3C%2FLINGO-LABS%3E
Choose Language Hide Translation Bar
Dan2
Level I

How to mark statistical result and put a color in the graph

Hi I am beginner of JMP

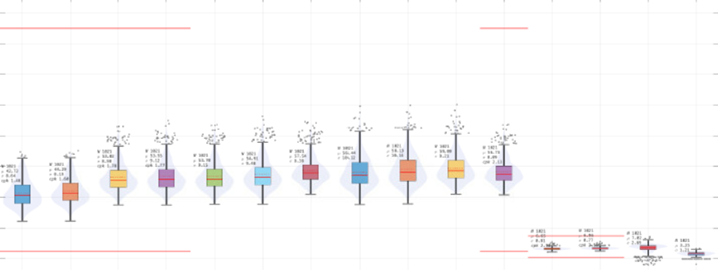
1. I would like to understand how to mark statistical result like below graph 

   I can see the box plot of many items below. Each item has its own quantity, mean, std, cpk value

   How can I draw a picture like this? I only know how to draw by graph builder. (Here I couldn't find any function for this)

2. How can I put colors like below picture? I cannot find it at graph builder function either.

Dan2_0-1623073808033.png


1 REPLY 1

Re: How to mark statistical result & put a color in the graph

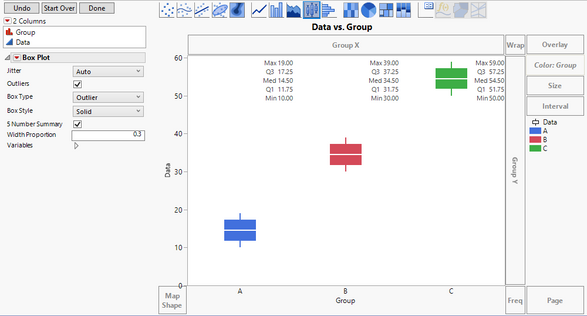
I am not able to see all of the details in your graph, but I hope this will get you what you need.


Drag your data column to the Y-axis. 

Drag your grouping column to the X-axis.

Change the graphing element to the boxplot.

Change the style to be Solid.

Check the 5-number summary box.

Drag the grouping column to the Color area.
In my example I also changed the width proportion so that the box did not overlap with the 5-number summary.

Capture.PNG

Dan Obermiller

Recommended Articles