- Mark as New
- Bookmark
- Subscribe
- Mute
- Subscribe to RSS Feed
- Get Direct Link
- Report Inappropriate Content
Hover labels in journals
Hi,
is it possible to enable hover labels in journals for data points on charts? This would be especially useful to help users understand a colour scale, for example.
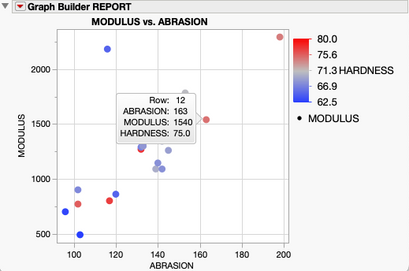
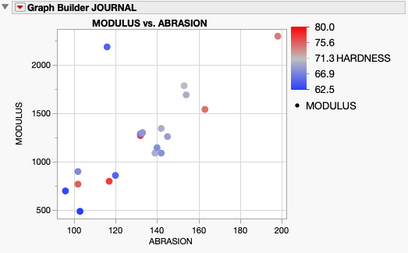
Very simple example: I create a graph builder chart using the code below. In the report window I can hover over a data point and see the value of HARDNESS, which is not easy to decode from the colour scale. However, in the journal, there's no hover label available.

I know the actual data values for x/y/colour are included in the journal code so it feels like it should be possible.
Names Default To Here(1);
dt = Open( "$SAMPLE_DATA/Tiretread.jmp" );
gb = dt << Graph Builder(
	Size( 350, 300 ),
	Show Control Panel( 0 ),
	Variables( X( :ABRASION ), Y( :MODULUS ), Color( :HARDNESS ) ),
	Elements( Points( X, Y, Legend( 13 ) ) ),
	SendToReport(
		Dispatch( {}, "Graph Builder", FrameBox, {Marker Size( 6 )}
		)
	)
);
gb << journal;
Thanks!
I am using JMP 17.2.
Accepted Solutions
- Mark as New
- Bookmark
- Subscribe
- Mute
- Subscribe to RSS Feed
- Get Direct Link
- Report Inappropriate Content
Re: Hover labels in journals
Hover Labels do not work in journals. They require dynamic linking between the platform with the plot and the data table. The journal is a static record of the platform at the time, but it is disconnected from both the live platform and the data table.
- Mark as New
- Bookmark
- Subscribe
- Mute
- Subscribe to RSS Feed
- Get Direct Link
- Report Inappropriate Content
Re: Hover labels in journals
hover on the data point, then once the lable comes up move your cursor onto the lable and click that little red "pin" looking icon. This stick the label to the graph. The label can be moved around and a tag line automatically appears.
Pinned lables show up in journaled graphs as well as in HTML exports (and probably everything else.)


