- Learn how to build custom Python data connectors and further customize JMP’s Data Connector Framework with the Python Data Connector Demo, available now in the JMP Marketplace!
- See how to use Accelerated Life Testing (ALT) to evaluate reliability. Register for June 5 webinar, 2pm US Eastern Time.
- Subscribe to RSS Feed
- Mark Topic as New
- Mark Topic as Read
- Float this Topic for Current User
- Bookmark
- Subscribe
- Mute
- Printer Friendly Page
Discussions
Solve problems, and share tips and tricks with other JMP users.- JMP User Community
- :
- Discussions
- :
- Re: Getting Rid of the "N" Column in a Tabulate Chart

- Mark as New
- Bookmark
- Subscribe
- Mute
- Subscribe to RSS Feed
- Get Direct Link
- Report Inappropriate Content
Getting Rid of the "N" Column in a Tabulate Chart
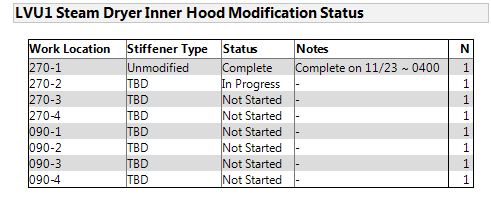
JMP Users I have developed a Tabulate Chart to show the installation status of some hardware, please see the attached file. My question is I would like to get rid of the last "N" column in the Tabulate chart and cannot figure out how to do that? See the script below for the Tabulate Chart:
- Mark as New
- Bookmark
- Subscribe
- Mute
- Subscribe to RSS Feed
- Get Direct Link
- Report Inappropriate Content
Re: Getting Rid of the "N" Column in a Tabulate Chart
JMP Users, I don't see the scrip that I had pasted into the question the script is:
T1 = CT << Tabulate(
Show Control Panel( 0 ),
Add Table(
Row Table(
Grouping Columns( :Work Location, :Stiffener Type, :Status, :Notes )
)
)
);
T1 << Title("LVU1 Steam Dryer Inner Hood Modification Status");

- Mark as New
- Bookmark
- Subscribe
- Mute
- Subscribe to RSS Feed
- Get Direct Link
- Report Inappropriate Content
Re: Getting Rid of the "N" Column in a Tabulate Chart
Add this line to the end of your chart script:
(T1 << Report)[MultiTblNumColBox( 3 )] << Delete;You might need to replace the number after MultiTblNumColBox. Check your table's Tree Structure to confirm.
I realize this is like 3 years late; but I found this thread while trying to answer the same question, so hopefully it's helpful to someone.

- Mark as New
- Bookmark
- Subscribe
- Mute
- Subscribe to RSS Feed
- Get Direct Link
- Report Inappropriate Content
Re: Getting Rid of the "N" Column in a Tabulate Chart
The best I could come up with was a blank column:

If you drag another measure (say mean) to the "N" column then you get missing data (as there is no mean to calculate). Then if you double click on the word "Mean" in the column heading you can change it to a blank. So maybe this will work, maybe not, depends on your endgame (i.e., is it a tool for you or a tool for others). Also, if you copy this table into word (or smoother document program) you could delete the column there.

- Mark as New
- Bookmark
- Subscribe
- Mute
- Subscribe to RSS Feed
- Get Direct Link
- Report Inappropriate Content
Re: Getting Rid of the "N" Column in a Tabulate Chart
This isn't really what the tabulate platform is supposed to be used for (not saying I haven't done it myself, but you do get the this count column issue...). There is an assumption that you must be interested in some kind of data - be it just how many times something shows up or some aggregate statistic.
The way I've been using lately for something like this is to actually go through a Journal (or if your handy with scripting you could make your own table report script - it's really easy). The steps for the Journal are below.
best,
M
---------------------------------------------
Adhoc Journal Tables
- Select data in the data table that you want in your "pretty" table.
- Select Edit > Journal (or te keyboard shortcuts cmd-J (mac) ctrl-J (windows).
- Enjoy the fruits of your strenuous table construction efforts.

- Mark as New
- Bookmark
- Subscribe
- Mute
- Subscribe to RSS Feed
- Get Direct Link
- Report Inappropriate Content
Re: Getting Rid of the "N" Column in a Tabulate Chart
Here is a simple piece of jsl that produces the table you want:
Names Default To Here( 1 );
dt = Current Data Table();
New Window( "Table",
Border Box( sides( 15 ),
tb = Table Box(
String Col Box( "Work Location", dt:Work Location << get values ),
String Col Box( "Stiffener Type", dt:Stiffener Type << get values ),
String Col Box( "Status", dt:Status << get values ),
String Col Box( "Notes", dt:Notes << get values )
)
)
);
tb << set shade alternate rows( 1 );

- Mark as New
- Bookmark
- Subscribe
- Mute
- Subscribe to RSS Feed
- Get Direct Link
- Report Inappropriate Content
Re: Getting Rid of the "N" Column in a Tabulate Chart
Also, in the fairly recent past, the 'DataTableBox()' was introduced, so you no longer have to mess with individual columns:
Names Default To Here( 1 );
dt = Open( "$SAMPLE_DATA/Big Class.jmp" );
New Window( "Example", dtb = Data Table Box( dt ) );
dtb << setShadeAlternateRows(1);
dtb << setShadeHeadings(0);
Recommended Articles
- © 2026 JMP Statistical Discovery LLC. All Rights Reserved.
- Terms of Use
- Privacy Statement
- Contact Us