- Learn how to build custom Python data connectors and further customize JMP’s Data Connector Framework with the Python Data Connector Demo, available now in the JMP Marketplace!
- See how to create experiments to support product design and ID useful product features. Register for June 12 webinar, 2pm US Eastern Time.
- Subscribe to RSS Feed
- Mark Topic as New
- Mark Topic as Read
- Float this Topic for Current User
- Bookmark
- Subscribe
- Mute
- Printer Friendly Page
Discussions
Solve problems, and share tips and tricks with other JMP users.- JMP User Community
- :
- Discussions
- :
- Access and change the name of a phase in a control chart

- Mark as New
- Bookmark
- Subscribe
- Mute
- Subscribe to RSS Feed
- Get Direct Link
- Report Inappropriate Content
Access and change the name of a phase in a control chart
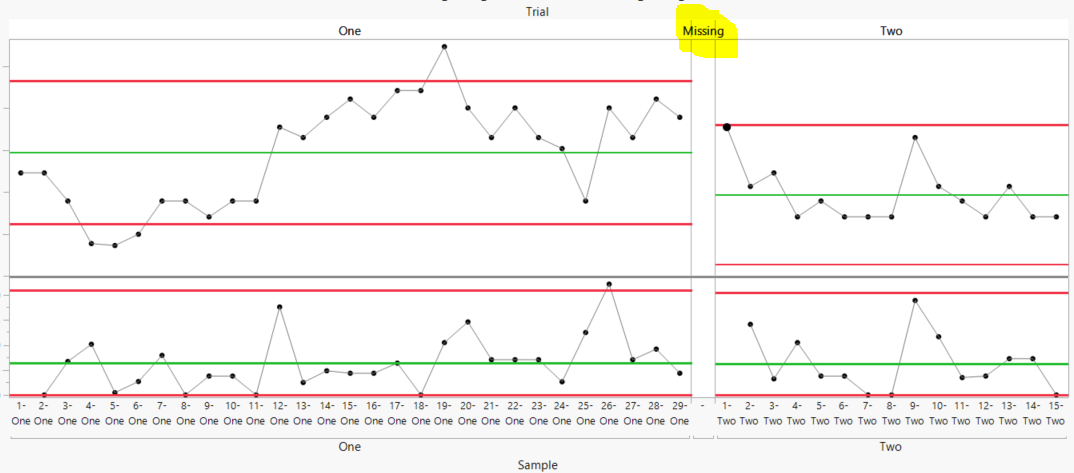
My data come from two different productions and creating control chart limits for these two conditions is what I want to do.
I have added a single row between the two productions which is essentially all "blank". This is to create a visual break.
When I create the chart the result is as seen in the attached PNG file.
What I a missing is the JSL syntax, or JSL know-how, to access the textseg so I can rename it to "", i.e. so no text appears. ("Missing" appears in the graph - see attached - because the cell in my data table is empty.)
My problem is how to access the relevant "textseg" so I can rename it. I have tried the Scripting help for a while now and I haven't cracked it.
I assume I need something that connects to the text seg and then uses << Set Text( "" );
Of course, you could rephrase my problem to be How to access a phase name (i.e. the textseg), using JSL, so that I can rename it to something else (which is different to the text found in the data table)?
Thanks in advance for any help.
Accepted Solutions

- Mark as New
- Bookmark
- Subscribe
- Mute
- Subscribe to RSS Feed
- Get Direct Link
- Report Inappropriate Content
Re: Access and change the name of a phase in a control chart
My first suggestion, is to change the Phase value of "Missing" to "_" which makes the spacing value not very noticeable..

The only thing that needs to be adjusted, to do this, is to use the column property "Value Order" to make sure that from an order of phase issue, that the "_" is in the correct place, between the "F" and "M" phases. Interactively this is easy to do, and the JSL to do it is:
dt:sex<<set property("value order",{Custom Order( {"F", "_", "M"} )});Now you can delete the segment as you suggested, but in doing this, I found a less than concise solution.

If you look into the Tree Structure of the Display Tree for the Control Chart Builder, it indicates that there are 6 Text Segs for the Frame Box() that contains the "M", "_" and "F" values. And, it turns out that segment 5 is the "_". However, it turns out that directly deleting Text Seg(5) does not work. The only way that I could get it to work, was to delete the segments 1, 2 and 3, one at a time, which left 3 segments, and then I could delete Text Seg(2). My test cases on data tables with more Phases, added more seeming blank Text Segs. That be what it may, the JSL to delete the "_" in my example is:
m=report(ccb)[framebox(1)]<<find seg( text seg(1));m<<delete;
m=report(ccb)[framebox(1)]<<find seg( text seg(1));m<<delete;
m=report(ccb)[framebox(1)]<<find seg( text seg(1));m<<delete;
m=report(ccb)[framebox(1)]<<find seg( text seg(2));m<<delete;
And below is the complete JSL for the value ordering graphing and removing the "_"
names default to here(1);
dt=open("$SAMPLE_DATA/big class.jmp");
dt << add rows(1);
dt:sex[nrows(dt)]="_";
dt:sex<<set property("value order",{Custom Order( {"F", "_", "M"} )});

ccb = Control Chart Builder(
	Size( 534, 464 ),
	Show Control Panel( 0 ),
	Show Capability( 0 ),
	Variables( Y( :height ), Phase( :sex ) ),
	SendToReport(
		Dispatch(
			{},
			"Control Chart Builder",
			FrameBox,
			{DispatchSeg(
				TextSeg( 4 ),
				{Line Color( "None" ), Fill Color( "None" )}
			), DispatchSeg(
				TextSeg( 5 ),
				{Line Color( "None" ), Fill Color( "None" )}
			), DispatchSeg(
				TextSeg( 6 ),
				{Line Color( "None" ), Fill Color( "None" )}
			)}
		)
	)
);

m=report(ccb)[framebox(1)]<<find seg( text seg(1));m<<delete;
m=report(ccb)[framebox(1)]<<find seg( text seg(1));m<<delete;
m=report(ccb)[framebox(1)]<<find seg( text seg(1));m<<delete;
m=report(ccb)[framebox(1)]<<find seg( text seg(2));m<<delete;
- Mark as New
- Bookmark
- Subscribe
- Mute
- Subscribe to RSS Feed
- Get Direct Link
- Report Inappropriate Content
Re: Access and change the name of a phase in a control chart
My first suggestion, is to change the Phase value of "Missing" to "_" which makes the spacing value not very noticeable..
The only thing that needs to be adjusted, to do this, is to use the column property "Value Order" to make sure that from an order of phase issue, that the "_" is in the correct place, between the "F" and "M" phases. Interactively this is easy to do, and the JSL to do it is:
dt:sex<<set property("value order",{Custom Order( {"F", "_", "M"} )});Now you can delete the segment as you suggested, but in doing this, I found a less than concise solution.
If you look into the Tree Structure of the Display Tree for the Control Chart Builder, it indicates that there are 6 Text Segs for the Frame Box() that contains the "M", "_" and "F" values. And, it turns out that segment 5 is the "_". However, it turns out that directly deleting Text Seg(5) does not work. The only way that I could get it to work, was to delete the segments 1, 2 and 3, one at a time, which left 3 segments, and then I could delete Text Seg(2). My test cases on data tables with more Phases, added more seeming blank Text Segs. That be what it may, the JSL to delete the "_" in my example is:
m=report(ccb)[framebox(1)]<<find seg( text seg(1));m<<delete;
m=report(ccb)[framebox(1)]<<find seg( text seg(1));m<<delete;
m=report(ccb)[framebox(1)]<<find seg( text seg(1));m<<delete;
m=report(ccb)[framebox(1)]<<find seg( text seg(2));m<<delete;
And below is the complete JSL for the value ordering graphing and removing the "_"
names default to here(1);
dt=open("$SAMPLE_DATA/big class.jmp");
dt << add rows(1);
dt:sex[nrows(dt)]="_";
dt:sex<<set property("value order",{Custom Order( {"F", "_", "M"} )});

ccb = Control Chart Builder(
	Size( 534, 464 ),
	Show Control Panel( 0 ),
	Show Capability( 0 ),
	Variables( Y( :height ), Phase( :sex ) ),
	SendToReport(
		Dispatch(
			{},
			"Control Chart Builder",
			FrameBox,
			{DispatchSeg(
				TextSeg( 4 ),
				{Line Color( "None" ), Fill Color( "None" )}
			), DispatchSeg(
				TextSeg( 5 ),
				{Line Color( "None" ), Fill Color( "None" )}
			), DispatchSeg(
				TextSeg( 6 ),
				{Line Color( "None" ), Fill Color( "None" )}
			)}
		)
	)
);

m=report(ccb)[framebox(1)]<<find seg( text seg(1));m<<delete;
m=report(ccb)[framebox(1)]<<find seg( text seg(1));m<<delete;
m=report(ccb)[framebox(1)]<<find seg( text seg(1));m<<delete;
m=report(ccb)[framebox(1)]<<find seg( text seg(2));m<<delete;
- Mark as New
- Bookmark
- Subscribe
- Mute
- Subscribe to RSS Feed
- Get Direct Link
- Report Inappropriate Content
Re: Access and change the name of a phase in a control chart
Recommended Articles
- © 2026 JMP Statistical Discovery LLC. All Rights Reserved.
- Terms of Use
- Privacy Statement
- Contact Us