cancel
Showing results for 
Show  only  | Search instead for 
Did you mean: 
  • Register to attend Discovery Summit 2025 Online: Early Users Edition, Sept. 24-25.
  • New JMP features coming to desktops everywhere this September. Sign up to learn more at jmp.com/launch.

Tables

Choose Language Hide Translation Bar

Latest Posts

  • Columns by Categories in Tabulate

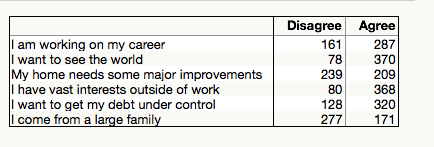
    What is "Columns by Categories" ?Survey data often have sets of questions that have common sets of responses, example, "ye", "no".Tabulate can summarize the responses for those questions and present the result very compactly,with the column names as row labels, and the answers as column headers, or vice versa.You don't even have to do anything special. If the columns are tagged as nominal or ordin...

    chungwei chungwei
    Tables |
    Oct 18, 2016 4:38 PM
    3583 views | 0 replies
    9061_tab1.png
  • Tabulate Totals

    What statistics does the keyword “all” compute ?Well, any statistics that you ask for.For example, I have a table of  min, mean, and max age of car buyers, grouped by country, size, and sex.I would like to have the 3 statistics aggregated by the grouping column “sex”,i.e., I want to have the min,  mean,  and max age for all the car buyers, irrespective of sex, in the same table.To get that, drag a...

    chungwei chungwei
    Tables |
    Oct 18, 2016 4:15 PM
    3790 views | 1 replies
    8748_mean age.png
  • Tabulate Report with Percentages in Multiple Tables

    A user once asked, can Tabulate show me the percentages of 2 groups,say, No and Yes, across different categorical columns,display the report with the No and Yes as column hearders, and the columns down as rows,so I can see the percentages simultaneously ?i.e., a table like this -

    Yes, Tabulate can, very easily.For this example, I am running JMP 12, using the data table Va Lung Cancer.jmp from the s...

    chungwei chungwei
    Tables |
    Apr 21, 2015 7:09 AM
    4108 views | 1 replies
    No supplied image