cancel
Showing results for 
Show  only  | Search instead for 
Did you mean: 
The Discovery Summit 2025 Call for Content is open! Submit an abstract today to present at our premier analytics conference.
Get the free JMP Student Edition for qualified students and instructors at degree granting institutions.
Choose Language Hide Translation Bar
View Original Published Thread

Survey analysis using “categorical” Part 3: Flexible analysis of multiple answers

This blog series demonstrates the usefulness of JMP's Categorical platform. Part 1 shows that it is possible to aggregate single answers, multiple answers, etc. Part 2 In this section, we showed how to compare response rates and scores by attribute (gender, age, etc.). In the final part, Part 3, we will show that there are various ways of holding data for multiple answers, and that any way of holding data can be treated as "categorical."


Lots of buttons related to multiple responses

As mentioned earlier, in "Categorical" you can specify the response role for each variable, but the "Multiple" tab has various buttons as shown below. Actually this is Mechanism that can flexibly handle multiple answers That's it.

undefined


Various input formats for multiple response data

For example, let's say there is a question Q1 with multiple answers, and the format is to answer all that apply among answer options 1, 2, 3, 4, and 5.

When the format is to input one person's answer in one line, the following input methods ①, ②, and ➂ can be considered as data input methods.


undefined


① (Q1) is entered in one cell using a delimiter (in this example, a comma ",").

② (Q1 1 to Q1 5) spans 5 columns, and answer choices are entered in order from the left column.

➂ (Q1-1 to Q1-5) spans 5 columns and is input with an indicator variable of 1/0. For example, the first line answers 1, 2, 3, so enter the value 1 for Q1-1, Q1-2, Q1-3, and enter the value 0 for Q1-4, Q1-5. .


The format ①, ②, or ➂ above is used depends on the ease of input for the person manually inputting the data, the survey collection system, etc. JMP's ``Categorical'' allows you to directly handle any data format as ``multiple responses'' without processing the data.


The figure below shows the corresponding input formats with numbers for the "Multiple" button.


undefined


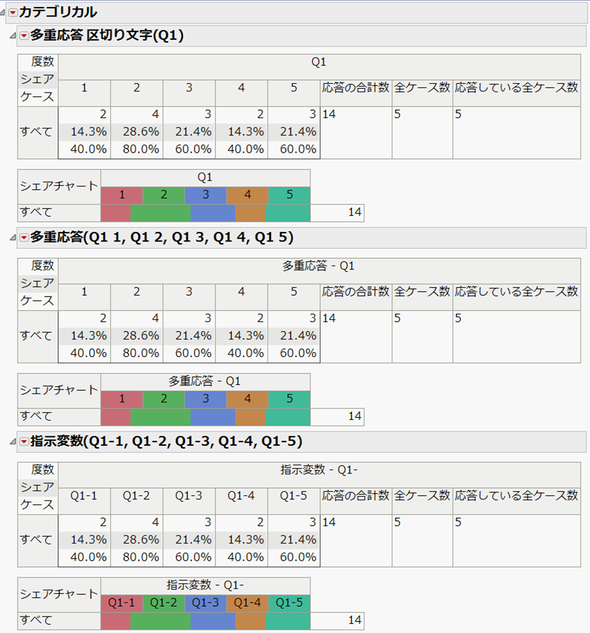
Of course, all methods ①, ②, and ➂ will output the same result.


undefined


However, it is better to combine multiple answers into one column.

However, When analyzing multiple responses in JMP, it is more flexible to enter them in one column using delimiters as in ①. ② and ➂, which are input across multiple columns, can be analyzed directly with "categorical", but cannot be handled as is with "univariate distribution".


But don't worry. In JMP, even formats such as ② and ➂ that span multiple columns can be easily converted to the delimiter format of ①.


Here, we will introduce a method to convert the indicator variable format of ➂ to ① using the multiple response column of the SQC training questionnaire introduced in this series.


How to combine multiple response columns into one column

  1. Select all the indicator variable columns (Q1_Required for work to Q1_6 Others), Columns > Utilities > Combine Columns Choose.
  2. In the Combine Columns window, specify the column name (the column name when a single column is created after this) and delimiter, as shown in the image below. [Selected column is indicator variable], [Multiple response] Check the box and click [OK].


undefined


Then, a new column "Q1" will be created as shown below. You can see that the values in this column contain multiple values separated by commas, and the scale is set to [Multiple Response].


undefined


The latest version "JMP 17" can handle multiple responses in graph builder

If you group them together in one column using the above method, you can analyze multiple responses using [Univariate distribution]. In the latest version of JMP 17, Graph Builder can now handle multiple response columns.


If you drop the newly created multiple response column "Q1" into the X zone, you can draw a bar graph that identifies the answers using delimiters and counts the frequencies as shown below.


undefined


Graph Builder is convenient because it allows you to flexibly configure settings such as sorting in descending order of frequency and changing the color and transparency of the graph.


The “categorical” platform explained in this blog series. How was it. Although it is a platform that is not well known or used, I hope that this blog will give you more opportunities to use it.

This post originally written in Japanese and has been translated for your convenience. When you reply, it will also be translated back to Japanese.