cancel
Showing results for 
Show  only  | Search instead for 
Did you mean: 
The Discovery Summit 2025 Call for Content is open! Submit an abstract today to present at our premier analytics conference.
Get the free JMP Student Edition for qualified students and instructors at degree granting institutions.
Choose Language Hide Translation Bar
View Original Published Thread

Survey analysis using “categorical” Part 2: From aggregation to analysis! ~Statistically comparing answer distributions between attributes~

The previous Part 1 We showed an example of using the "categorical" platform to aggregate answers in various formats (single response, multiple responses, scores) in survey data at once.


However, at the level of tabulation, you can do your best with spreadsheet software, and if you are using a survey system, the system will display the tabulated results in tables and graphs.


So, what are the benefits of using JMP's ``Categorical''?

That is what I will introduce this time. Compare answer distributions between groups That's the thing.


Specify group variables as “categorical”

In survey analysis, in addition to aggregating individual responses, responses are also aggregated by respondent attributes (gender, age, etc.). This is what is called a cross tabulation.


Let's consider the example of SQC training covered in Part 1. In this example, there is an attribute called ``Job Title'' (general, with job title), so let's aggregate and compare the other responses by job title.


undefined


Let's perform the following analysis on the data table above.

Position × Reason for taking the course (multiple answers): Multiple answers

Job title × Experience using statistical software (single answer): Nominal scale

Job title × time allocation, text structure, practicality (score): ordinal scale

Position × Satisfaction (score): Ordinal scale


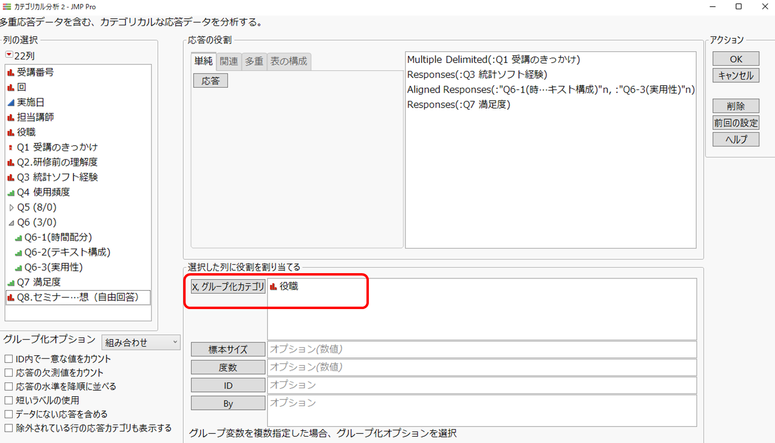
At this time, in "categorical", "position" is defined as follows. [X, grouping category] Specify.


undefined


Test for homogeneity of proportions (are the proportions of responses different between groups?)

First, let's look at the report for the multiple responses of "trigger for taking the course" and the nominal scale of "experience with statistical software" (yes/no). As shown below, a cross-tabulation table is displayed that is divided into "general" and "with job title", and the corresponding share chart is also displayed.


undefined

Comparing the share of responses for "reasons for taking the course" between general and job titles, there seems to be a difference in share for the following items.


Supervisor's instructions: General (24.7%), specific position (16.8%)

Interest in SQC: General (8.9%), Job title (16.1%)


There also seems to be a difference in terms of experience with statistical software, with 39.6% of respondents having general experience and 50.9% of those with job title experience.


What I have described here is only to indicate that there seems to be a difference. Since I am using statistical software, I would like to check whether there is a statistical difference. Therefore, we use the test option under "Categorical".


Homogeneity test for non-multiple responses

For answers that are not multiple responses, such as experience with statistical software, [Test for homogeneity of response] Execute options.


Homogeneity of responses is tested between groups, but here we are testing the hypothesis that the proportion of responses is equal between positions. This is equivalent to the chi-square test used to check the independence of crosstabulation tables.


undefined


The p-values for the report's likelihood ratio chi-square and Pearson's chi-square are less than 0.05, so if the significance level of the test is set to 5%, the responses are not homogeneous, that is, there is a difference in the proportion of statistical software experience between positions. It shows that there is.


Multiple response homogeneity test

For "Reason for taking the course", which has multiple answers, [Multiple response test] is used. Here, we assumed a binomial distribution of selection/non-selection for the response categories. [Homogeneity test of binomial distribution] Shows the report.


undefined


The report Binomial Test for Each Response displays statistics comparing the proportion of responses for each question between groups.


For example, for the response "supervisor's instructions," the total number and respondents are as follows.

In general, 144 out of 392 people are applicable (36.7% = 144/392)

26 out of 111 people with a job title (23.4% = 26/111)


At this time, the chi-square value and p-value (=0.0074) are calculated using a logistic model where the response rate is Y (assuming a binomial distribution) and general/positional is X.


If you look at the report "binomial test for each response", you will notice that there is a significant difference in the two items "supervisor's instructions" and "interest in SQC". This suggests that ordinary employees took the seminar because their boss told them to do so, and that those with positions were interested in SQC itself.

For other items, although there are differences in the percentages between general and those with positions, the differences do not seem to be significant.


Compare scores

Questions that ask about product satisfaction are often answered using a score such as a five-point rating. You will want to see if there are any differences in scores between groups.


In this example, we asked participants to rate the seminar's time allocation, text structure, and practicality on a 5-point scale, and to rate their satisfaction with the seminar on a 10-point scale. If you want to compare these evaluation scores between positions, do the following: [Comparison of score averages] I'll try using


undefined


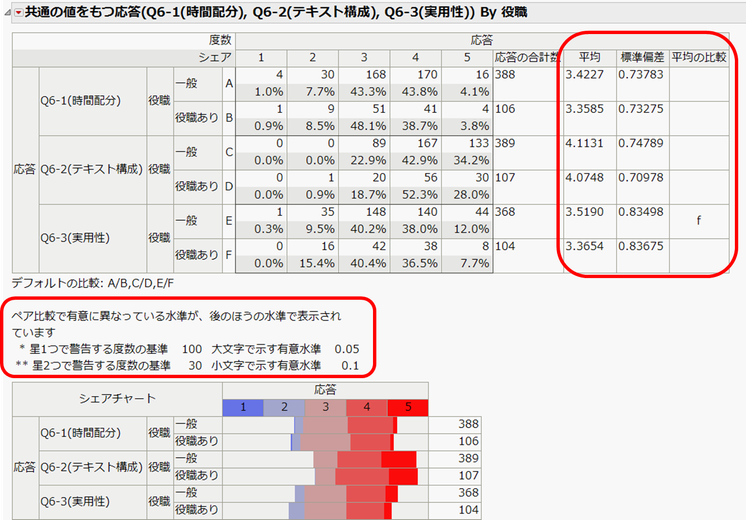
This is a report on seminar time allocation, text structure, and practicality. On the right side of the crosstabulation table, the average and standard deviation are displayed when responses 1 to 5 are considered as scores.


undefined


If you look at the last column "Comparison of Means", you will see the letter "f" in the 5th row (score for general practicality, labeled E). This shows that the 6th line labeled F (score for practicality with job title) is significant at a significance level of 0.1. (Please refer to the explanation circled in red in the figure.)


Regarding practicality, the general score average was 3.52 and the title score average was 3.37, but when these averages were compared pairwise, the p-value of the test (using t-test) was smaller than 0.1. Those with job titles may have been a little more dissatisfied with the practicality of the seminar than the general public.


Please also refer to the report on the "satisfaction level" of the seminar.


undefined


The general average is 7.23, and the average for those with titles is 6.91, and the letter "B" is displayed in the "Average comparison" column. The uppercase letters indicate that the value is significant at the 0.05 significance level in this case. Regarding satisfaction with the seminar itself, there was a significant difference in scores between general and those with job titles.


Effective for comparison between groups for many questions

With "Categorical", you can perform aggregation and comparison by group by specifying a grouping variable. In fact, surveys may have many questions and many answer options. In such cases, many tables and graphs are displayed, so it can be difficult to examine each answer one by one to find out which answers are different.


By using the ``test for homogeneity of responses'' and ``comparison of score averages'' explained this time, items with differences can be seen at a glance, allowing for efficient comparison of responses between groups.


In the next Part 3, we will explain in detail about "multiple responses," which deals with multiple-response questions in surveys.

This post originally written in Japanese and has been translated for your convenience. When you reply, it will also be translated back to Japanese.