- We’re retiring the File Exchange at the end of this year. The JMP Marketplace is now your destination for add-ins and extensions.
- JMP 19 is here! Learn more about the new features.
JMPer Cable
A technical blog for JMP users of all levels, full of how-to's, tips and tricks, and detailed information on JMP features- JMP User Community
- :
- Blogs
- :
- JMPer Cable
- :
- Who, what, why, and how? Tools for modeling and visualizing moderation and moder...
- Subscribe to RSS Feed
- Mark as New
- Mark as Read
- Bookmark
- Subscribe
- Printer Friendly Page
- Report Inappropriate Content
Often as we are trying to gain insights from our data, understanding that two variables are related is not enough. We need to dig deeper and ask questions like: under what circumstances are they related? For whom are they related, why are they related, and how? Moderation, mediation, and moderated mediation allow us to answer exactly these types of questions.
These analytic techniques, referred to as conditional process models (Hayes, 2022; Preacher et al., 2007), are popular and important but cumbersome to fit. Furthermore, visualizations that are essential for understanding interactions, including Johnson-Neyman plots and simple slopes plots, are difficult to create and require error-prone calculations.
The Moderation and Mediation JMP Add-In described in this post enables easy specification, fitting, and visual probing of interactions in three popular models: moderation, first-stage moderated mediation, and second-stage moderated mediation. These models can be fit with ordinary least squares or with structural equation modeling (SEM) software; the Add-In relies on SEM, which handles missing data with cutting-edge methods and enables simultaneous model estimation. (This Add-In requires JMP Pro 16.0 or later.)
The simplest way to describe these conditional process models is by using an example. Let’s consider this clip from an article in scienceofpeople.com about improving job satisfaction:
“Do you know your company’s mission? Do you know the impact of your work? When we don’t have our “why” at the front of our mind, it can be hard to feel motivated and excited about what we are doing… When we get busy or overwhelmed, the “why” just seems to slip away.”
Basic Moderation Example
Under what circumstances is meaningfulness of our work related to job satisfaction?
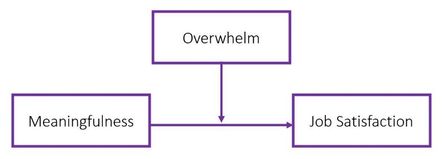
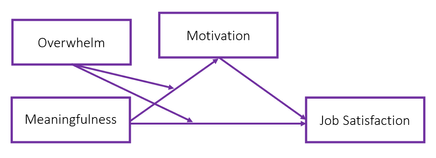
The above clip suggests that meaningfulness of our work is related to greater job satisfaction, but if we are too overwhelmed at work, this relation diminishes. In other words, overwhelm moderates the relationship between meaningfulness and job satisfaction (i.e., there is an interaction effect). Conceptually, we can represent this with a path diagram:
So how do we test for this interaction effect and, if it is statistically significant, understand its meaning? The steps below outline how to do this with the Moderation and Mediation Add-in.
User Input
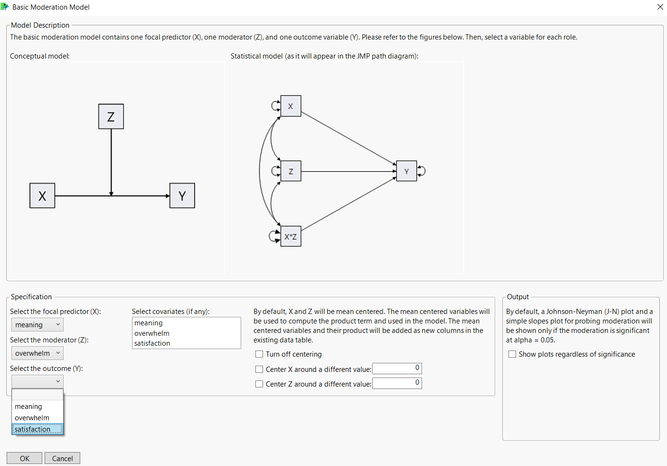
First, the user input window illustrates the conceptual path diagram alongside the statistical model that will be fit in the SEM platform of JMP Pro. Making the connection between these two model representations can be difficult, so this feature seeks to aid user understanding of the statistical model being fit.
All that’s required from the user is to indicate which variable takes on each role in the model: the predictor (X), the moderator (Z), and the outcome (Y). Optionally, any number of covariates can be included to control for their effects. All variables must be continuous.
All that’s required from the user is to indicate which variable takes on each role in the model: the predictor (X), the moderator (Z), and the outcome (Y).
By default, X and Z will be mean-centered. The mean-centered variables will be used to compute a product term (X*Z) for model fitting. If desired, this feature can be turned off and X and Z will remain uncentered. Furthermore, X and Z can be centered around a user-specified value.
The final section of the user input window concerns what will be shown in the output report. By default, text and plots for probing moderation will only be displayed if the interaction term (X*Z) is significant at alpha = .05. The user can opt to see these results even if the interaction term is non-significant (for example, if an alpha = .10 significance level is desired).
Results
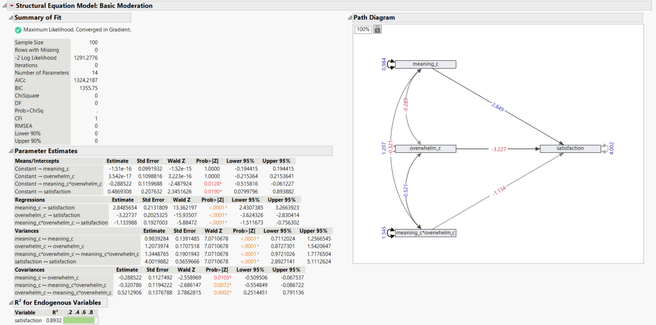
SEM Output: The first section of the output report shows results from the SEM platform, including model fit statistics, parameter estimates, a path diagram of the model, and the proportion of variance explained in the outcome. In the Path Diagram, covariances will not appear if 1 or more covariates have been included (to reduce image clutter). Covariances, and other estimates, can be displayed by right-clicking within the diagram and selecting Show > Covariances.
Moderation Details: This section provides succinct text explanations of results that can easily be pasted into publications or reports, including boundaries of significance calculated by the Johnson-Neyman (J-N) technique. The J-N technique calculates values of the moderator at which the simple slope of X transitions from significance to non-significance. There may be zero, one, or two significance boundaries within the observed range of the moderator. In some cases, boundaries cannot be calculated because the simple slope of X is significant or non-significant across the entire possible range of the moderator. In these cases, this information will be displayed and the J-N plot will still appear in the report.
The Moderation Details section provides succinct text explanations of results that can easily be pasted into publications or reports.
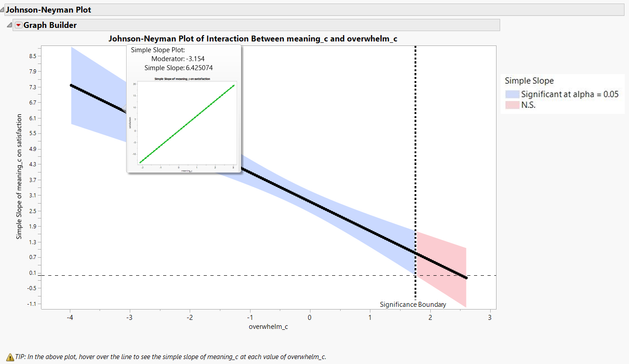
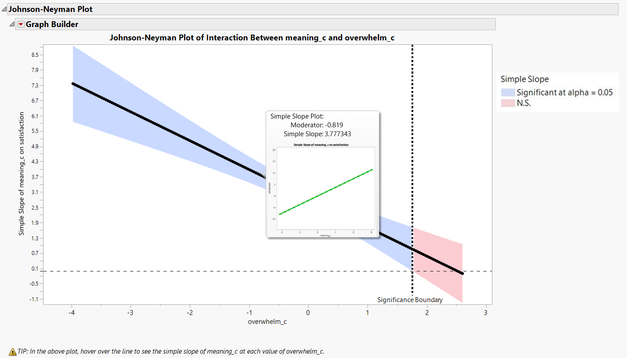
Interactive Johnson-Neyman Plot: The J-N plot is considered the most informative and state-of-the-art tool for visually probing interactions. Here, the moderator is on the x-axis and the simple slope relating X to Y is on the y-axis. So, we can see how the simple slope relating X to Y changes as the moderator changes. Confidence bands indicate whether the simple slope at each value of the moderator is significant (blue) or non-significant (red) at alpha = .05.
In our example, we see that meaningfulness is significantly related to job satisfaction at low-to-medium levels of overwhelm (recall the x-axis has centered values). As overwhelm increases, the association between meaningfulness to job satisfaction decreases. Indeed, the J-N plot helps us identify the precise value of overwhelm (1.75) at which this association is no longer statistically significant.
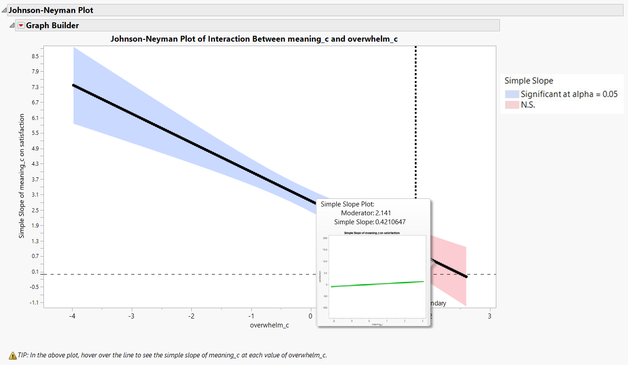
Despite all the information they provide, J-N plots can be difficult to digest because a simple slope is on the y-axis. To solve this problem, I made this plot interactive! Hover over the line to see a plot of Y vs. X at that particular value of the moderator. As you hover your mouse over different points on the line, it becomes easy to see how the relationship between X and Y changes as the moderator changes.
Hover over the line to see a plot of Y vs. X at that particular value of the moderator.
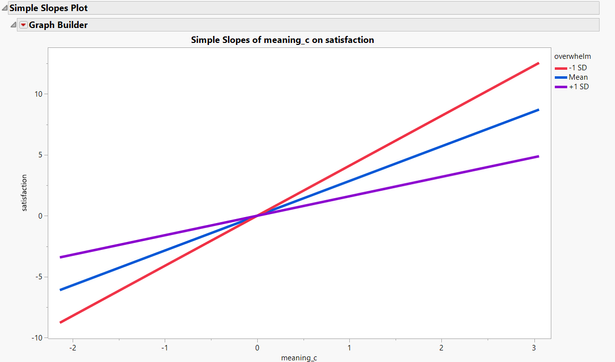
Simple Slopes Plot: Finally, a simple slopes plot will appear at the bottom of the report. Here, the relationship between X and Y is displayed at three values of the moderator: 1 SD below the mean, the mean, and 1 SD above the mean. This plot is not static, so feel free to alter axis titles, legend labels, or line type and color – whatever you need for your publication or report! Tip: use double-click and context menu to find these options.
First- and Second-Stage Moderated Mediation Examples
Why, how, and for whom is meaningfulness of our work related to job satisfaction?
For both first- and second-stage moderated mediation, the user input window and output report will look nearly identical to that of the basic moderation model. The key differences here are all about interpretation of results. Instead of simple slopes, plots will show conditional indirect effects at each value of the moderator. A conditional indirect effect is similar to a simple slope in that it depends on the value of the moderator. But now, we are describing the effect of X on Y through the mediator, M. These reports do not probe pieces of the pathway (for example, X-to-M, M-to-Y), but instead, the entire pathway from X to Y through M (i.e., the indirect effect). This entire indirect effect is moderated by Z, and is usually of greatest interest for probing and significance testing.
A couple of notes: both of these models rely on the assumption that sample size is large, because standard errors of the indirect effect are computed by normal-theory methods, not with bootstrapping. (Though look out for bootstrapping capabilities in future versions of the SEM platform in JMP Pro!) Additionally, in the first-stage model, Z is specified to moderate both the X-to-M and X-to-Y path to ensure proper model specification in the SEM platform. Moderation of the X-to-M path is typically of interest here, so results do not focus or provide detail on the moderation of the direct X-to-Y path.
First-Stage Moderated Mediation
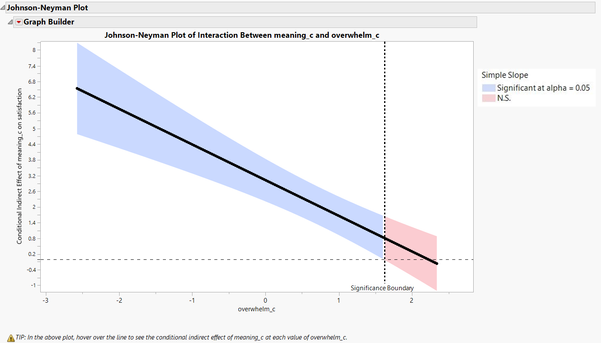
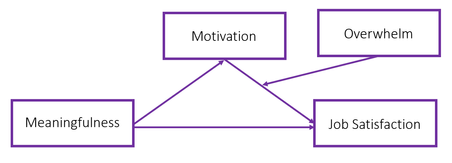
In our example, overwhelm significantly moderates the pathway from meaningfulness to motivation. Therefore, the entire indirect effect from meaningfulness to job satisfaction is moderated. The indirect effect is significant when overwhelm is less than 1.63. Thus, when overwhelm is low-to-medium, finding meaning in one’s job leads to greater motivation, which in turn leads to more job satisfaction.
Second-Stage Moderated Mediation
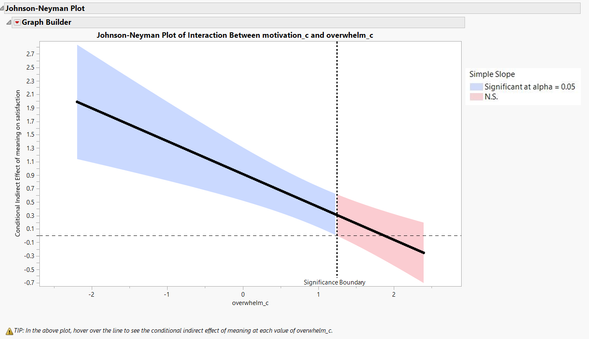
In this example, overwhelm significantly moderates the pathway from motivation to job satisfaction. The entire indirect effect from meaningfulness to job satisfaction is significant when overwhelm is less than 1.25. As in the previous example, when overwhelm is low-to-medium, finding meaning in one’s job leads to greater motivation, which in turn leads to more job satisfaction.
Replicate any of these results with the attached simulated data sets!
For more detail, see:
Bauer, D. J., & Curran, P. J. (2005). Probing interactions in fixed and multilevel regression: Inferential and graphical techniques. Multivariate Behavioral Research, 40(3), 373-400.
Hayes, A. F. (2022). Introduction to Mediation, Moderation, and Conditional Process Analysis: A Regression-Based Approach (3rd Ed.). Guilford.
Preacher, K. J., Rucker, D. D., & Hayes, A. F. (2007). Addressing moderated mediation hypotheses: Theory, methods, and prescriptions. Multivariate Behavioral Research, 42(1), 185-227.
To contact me, email haley.e.yaremych@vanderbilt.edu
You must be a registered user to add a comment. If you've already registered, sign in. Otherwise, register and sign in.
- © 2025 JMP Statistical Discovery LLC. All Rights Reserved.
- Terms of Use
- Privacy Statement
- Contact Us

