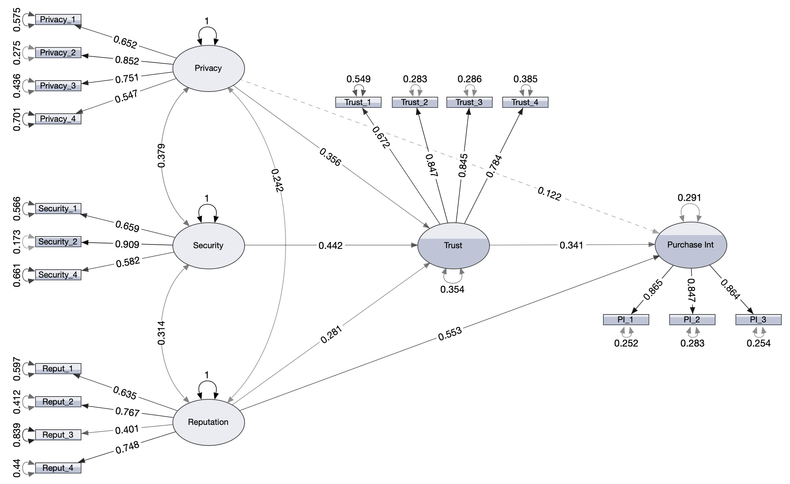
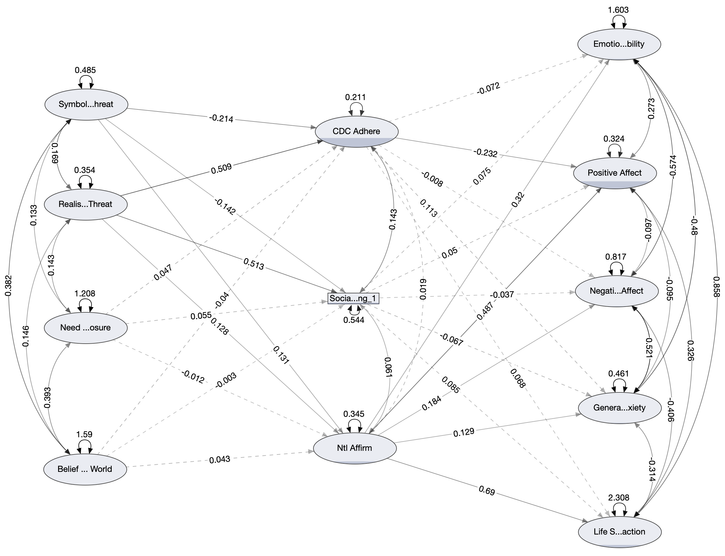
A central feature of structural equation modeling (SEM) is the availability of path diagrams that convey statistical models intuitively. For example, a model can be expressed as a system of linear equations or a path diagram that even a young child can understand:
 Factors that predict the taste of candy expressed as a system of structural equations and as a path diagram.
If you’re an SEM user, we both know the countless hours you’ve spent drawing and editing path diagrams so you can convey your results to your audiences. If you’re not a current SEM user, then you can avoid the pain of using secondary software to draw those diagrams just right.
The SEM platform of JMP Pro 16 has amazing features, including presentation-ready path diagrams that can be copied as vector images to be used in presentations and publications (yes, even this pink candy diagram was created in the SEM platform!). We don’t want you to spend too much time doing customizations; after all, you’re already spending time doing high-level stats! So we’ll get you as far as we can, leaving enough room for you to express your artistry, but only if you so desire.
Interactive model specification
Path diagrams in the SEM platform are fully interactive, enabling users to specify models directly on the canvas or make changes to previously specified models. All elements are selectable, and context menus unveil options to add latent variables, regressions, covariances, and even set constraints. And if your models are too complex for drawing directly, then you can always check out our list UI to get the best of both worlds: efficiency of specification and visual appeal.
It’s simple to convey results
Dashed lines, bold lines, transparency…you name it, we take advantage of it all. Arrow characteristics are mapped to effect sizes and statistical significance, making it easy to process model results visually. And if that weren’t enough, dependent variable nodes are shaded according to the proportion of variance explained by their predictors, because a picture is worth a thousand words!

Statistical model = path diagram (really!)
There are numerous conventions for drawing path diagrams, and not everyone agrees on which convention is best. RAM notation (stands for reticular action model, McArdle & McDonald, 1984) is my favorite because diagrams depict statistical models with full precision: If you see it, it’s there; if you don’t, it’s not. Alas, it’s not without its disadvantages, as diagrams can easily become cluttered, sometimes to the point where they stop being useful – especially if visualizing the mean structure.

We tackled this issue in the SEM platform by using RAM notation as default while allowing users to hide elements of the diagrams at their discretion (but we’ll let you know if you’ve hidden something important to avoid specification mistakes). This can be useful, for example, when focusing on structural relations between latent variables, or when many covariances obstruct the visualization of regression effects. The cluttered path diagrams above can be improved by hiding the means and loadings.

This video shows how simple it is to clean up your path diagrams to convey results effectively.
Appearance
Often, less is more when it comes to path diagrams, so our default path diagram is clean and simple. However, you may have your own reasons for changing the appearance of path diagrams, and our customize menu allows you to do just that – from node sizes and arrow thickness, to colors and fonts, the choice is yours!
Interactive Layout
We don’t want you to feel like you are stuck with our layout choices. You can interact with the path diagram elements and rearrange them to your liking. But we wouldn’t want you to spend too much time on this, so we have options to speed up the process. Check out a few of these in this video.
Creating great-looking path diagrams that convey information efficiently is really easy in JMP Pro!
References
McArdle, J. J., & McDonald, R. P. (1984). Some algebraic properties of the reticular action model for moment structures. British Journal of Mathematical and Statistical Psychology, 37(2), 234-251.
You must be a registered user to add a comment. If you've already registered, sign in. Otherwise, register and sign in.