cancel
Showing results for 
Show  only  | Search instead for 
Did you mean: 
JMP is taking Discovery online, April 16 and 18. Register today and join us for interactive sessions featuring popular presentation topics, networking, and discussions with the experts.
Choose Language Hide Translation Bar
Saving graphs, tables and reports in JMP

Saving and sharing your output from JMP is easy. Here are some simple ways to save both tabular output and/or graphs in JMP.

Method 1: Copy and Paste

When you copy information from JMP, you can either use “Copy” from the Edit menu or Control-C (or Command-C on the Mac). The information is copied to your clipboard and can be pasted in a variety of applications.

If you want to save the whole report output with graphs, simply choose Edit > Copy to store the active window to the clipboard and then paste the results in your document.

You can also save just a portion of the results by choosing the Selection Tool (or “fat-plus" tool) from the toolbar (or Tools>Selection) and then clicking on the table, column or graph you would like to save. You then copy and paste as before.

tools.png


For example:

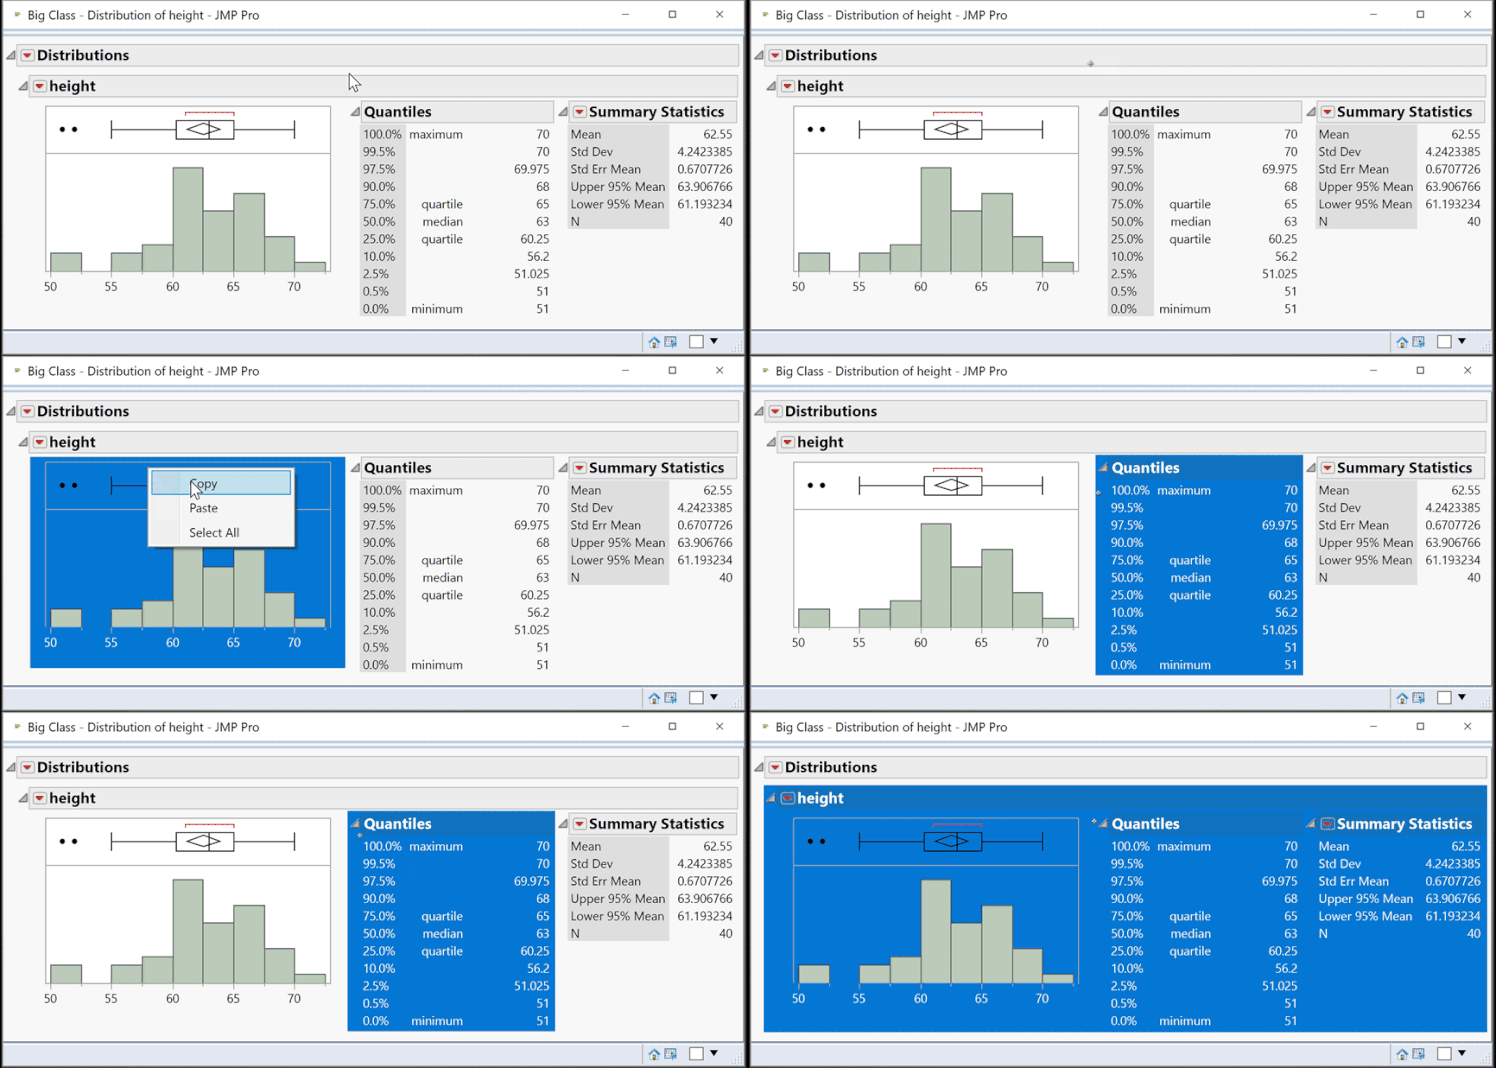
a. From any JMP output window, click on the selection tool in the toolbar (the fat plus)

b. Click on the content you want to copy. The selected content is highlighted. To extend a selection, hold the Shift key

c. Click Edit > Copy,  or Right Click > Copy
 

select-copy.gif


d. Open the program where you’d like to paste the content. On a Mac select Paste. On Windows, if using a Microsoft Office product, such as Word or PowerPoint, select Paste>Paste Special. From the list, select Picture (Enhanced Metafile). By selecting Picture (Enhanced Metafile), you have the ability to grow and shrink the image, ungroup the image for manipulation. This options also takes up less storage space. Once the image has been pasted in your application, if you right-click within the image and select Edit Picture, you then have the ability to manipulate that image.

savinggraphs2.JPG


Method 2: Saving an Entire Report

Select File>Save (or File > Export on a Mac). This method allows you to save your customized report output as a graphic, PowerPoint presentation, Word document, RTF file, or Interactive HTML. The text format is the only format that doesn't save graphs. Using File > Save (on both Mac and Windows) also allows you save your report as a JRP, a JMP Report File, which can either embed your data, or link to the original data. This report can be shared with others who have JMP so they can interact with your report.

Method 3: Save Selection As

You can also save selected graphs or tables by choosing Edit>Save Selection As (or on a Mac, hold the Control key, and select File > Save Selection As). This option allows you to save the selected item as a graphic in a variety of formats, including png, jpeg, svg, eps, pdf, tiff, and gif.

Method 4: Journaling

Select Edit>Journal. This will produce a static version of the report in a new window. This is useful when you want to share the output in JMP format, but do not want to share the underlying data. Journals contain the graphics, tables, and script of the report, but not the data. Select File > Save to save this Journal. 

To learn more about saving data tables, graphics and reports, refer "Save and Share Data" in the JMP documentation.

Last Modified: Jun 14, 2019 8:41 AM
Comments
WP_Comment
Visitor

Lyanne wrote:

I have to say saving any output (graph, fit model direction,analysis output) is to totally not straightforward or user friendly. I couldn't even figure out how to do it. In JMP 7 All I had to do was have the window in question open, click on and hit "save as" under "File"....

Am I missing something here? Is this because I have a demo version right now?

WP_Comment
Visitor

Morgan Zeliff wrote:

I've had the same problem as Lyanne. I have no way of saving the graphs that I make. I also have no way of exporting them as image files. I don't have a demo version of JMP though, I have JMP Pro 9 and a temporary licence.

The problem is that there is not a menu bar in any of the windows in which the graphs are made. I have a friend with a Mac who does not have this issue, but for my PC it seems to be a problem. I'd love any help that any one can offer!

WP_Comment
Visitor

Kendra Seaman wrote:

I'm having the same problem as Morgan. We're using the student version of JMP and cannot export graphs. In the Mac version of JMP 9 you can export reports as text files, image files, HTML files or RTF files. How can we do this on the PC version of JMP 9? Thanks!

WP_Comment
Visitor

Mary Loveless wrote:

The menu bar in JMP 9 disappears, so the Selection tool that allows copying and pasting of JMP output (the fat plus sign) is hidden. To view the menu bar, click the alt key. Then, use the selection tool to select output you'd like to copy. In addition you see other menu options such as the File > Save as.

FYI - you can change the JMP preferences so the menu always displays if the hidden menu bothers you - go to File > Preferences > Windows Specific. There's an option about 2/3 of the way down that controls this. This way your menu will be visible on all open JMP windows.

Let me know if I have answered your question(s).

--Mary

WP_Comment
Visitor

Jason Martin wrote:

I have roughly 40 plots that are generated using a script in JMP 8 and JMP 9. Is there any way to have all of these saved in bulk? I am getting rather bored with saving each one one at a time.

WP_Comment
Visitor

Stephen Deason wrote:

Mary,

Thank you. The menu being hidden by default is an extremely frustrating "feature." In response to your above message: I appreciate your advice; it was exactly what I needed to know.

If you happen to be part of the JMP team, would you please let your team know that, moving forward, changes like this (to the GUI) need to be appropriately followed with changes to the help documentation?

Thank you.

Stephen

WP_Comment
Visitor

Erich Zorn wrote:

I'm using JMP Pro 10.0, and I was having a heck of a time figuring out how to simply save a graph as an image file for inclusion in a presentation. The help documentation was utterly useless. I am glad I found Mary's comment above, or I would have been lost forever. Wheat kind of "feature" is hiding the menu on every window except the home screen? A useless feature and very frustrating to say the least.

WP_Comment
Visitor

Ruth wrote:

I'm using JMP 10 on windows and a colleage showed me how to keep menus visible at all times. Go to File > Preferences > Windows Specific. Then, near the bottom change 'Auto-hide menu and toolbars' to Never.

Hope this helps!

WP_Comment
Visitor

pattheplant wrote:

Completely agree with the above posts. Using JMP 10 and auto hiding the save menu resulted in me spending over an hour going around in circles in the help menu. Utterly stupid "feature" to hide an essential tool bar with no prompts. Dont think this is the last complaint you will hear either. Not a good start JMP, not a good start!

WP_Comment
Visitor

Lenny wrote:

I have the same problem as Jason Martin, I'm using JMP 9, and is there a way to include in the script a way to save many generated tables as an image.

WP_Comment
Visitor

Mary Loveless wrote:

You can definitely save JMP reports via scripting. But as for a way to save many generated data tables via scripting, I am not sure.

I know the suggestions below are not an automated way, but this is a way to capture an image of your data table(s).

You can save data table to a journal and via scripting create an image that way. Here are the steps for getting the data table into a journal:

1. Have a journal open

2. Have data table be the active view (it what youâ re looking at)

3. Go to the menu: Edit > Journal

This will put the columns of your data table into the journal. Then you use the journal functions to create the view you want.

Is this saved data table output within the journal what youâ re looking to create?

Another options is to use a tool like â Snag itâ or PrtSc (Print Screen) to take a snapshot of the data table and then save it in the format you want, for example, jpeg, gif or other.

Can you describe for me why you want an image of your data table?

As for being able to automate this process I will need some time to investigate...

WP_Comment
Visitor

Emily wrote:

I am unable to save all my graphs as a JMP report. I have a data table of about 700 records, and I have generated 3 Bivariate Fit (Fit Y by X) graphs based on the 3 study areas. I have changed the formatting the way I want it for a paper, etc, and would like to save everything so that I do not have to keep regenerating and reformatting the graphs. But when I choose "Save As" to save the JMP report, it only saves 1 of my graphs, and the data table that I embed with it, only saves the data for 1 of the study areas---it deletes everything else!

I have tried "Select All", I have ensured that either all the rows in my JMP table are selected, or none at all before saving the JMP report. Still, only 1 graph and only the rows of data for the 1 study area are saved. I have tried Edit>Select All in the Fit Y by X graphs menu options, but still only 1 graph and corresponding data are saved. I don't understand why this is is occurring??

I am using JMP Pro 10. I have managed to save these 3 graphs in other JRP files, but for some reason it does not work for me now. Perhaps an update or change in this newer version?

Any help or advice would be great!

WP_Comment
Visitor

Fethon Naoum wrote:

Mary, your post answered my question! I recently upgraded from JMP 8 to JMP 11 and was really puzzled on how to save grapsh etc. I went through old posts online and discovered this one.

Thanks!

WP_Comment
Visitor

Nicole wrote:

Thanks! This helped me so much!!!

WP_Comment
Visitor

Ben wrote:

This worked for me:

pic=

Contour Plot(

X( :x, :y ),

Y( :z ),

Show Data Points( 0 ),

Fill Areas( 1 ),

Label Contours( 0 ),

Transform( "None" ),

Specify Contours(

Min( 10 ),

Max( 10 ),

N( 7 )

);

);

pic<

WP_Comment
Visitor

Ben wrote:

pic=

Contour Plot(

X( :x, :y ),

Y( :z ),

Show Data Points( 0 ),

Fill Areas( 1 ),

Label Contours( 0 ),

Transform( "None" ),

Specify Contours(

Min( 0),

Max( 100 ),

N( 7 )

);

);

pic

WP_Comment
Visitor

Julian wrote:

I am using JMP Pro 10 for Mac.

I can export graphs, no problem. But on every exported graph the menu header shows up. It is this greyish bar with a red arrow saying "Graph Builder". How is it possible to export graphs without the drop-down menu bar included in the picture file?

While we're at it: I am also having trouble changing the font size of my X and Y axis labels. I can change the font size of my axis tick marks but that's it.

Any help is very much appreciated since I am on the brink to frustration!

XanGregg
Staff

Xan Gregg wrote:

Hi Julian, I hope I can pull you from the brink!

You can export only the parts of a report you want my using the "fat plus" selection cursor. Then only those parts are exported. So you can select everything except the outline title. There is another tricky way to do it, which is to double click the title and set it to empty and the whole thing will disappear. Just don't ask me how to get it back.

For the axis title font, that functionality was inadvertently masked in Graph Builder. It's fixed in the upcoming JMP 12, but a work-around for JMP 10 is to Journal the report first. Then you can right click on the axis title to change the font and export from there. If you need a live report, there are also scripting work-arounds for within Graph Builder.

BTW, don't forget the JMP Community discussion site next time you're stuck.

ArnoG
Level II

i must agree with pattheplant

Spent months without knowing there was an hidden menu, spent an hour to figure how to save graphs in svg and find this menu... pff :'(