cancel
Showing results for 
Show  only  | Search instead for 
Did you mean: 
  • JMP Security Notice: CVE-2026-109618 and CVE-2026-109619

    JMP promptly initiated a review of its products, services, and relevant infrastructure for exposure to CVE-2026-109618 and CVE-2026-109619.

    Our assessment of JMP products has not identified exposure to these vulnerabilities. Where remediation was required within supporting environments, appropriate security updates and controls have been applied and validated.

    We have identified no evidence of successful exploitation or unauthorized access to JMP systems or customer information associated with these vulnerabilities.

    JMP continues to monitor the issue and relevant vendor guidance. No action is required by JMP customers at this time.

  • Don’t miss your chance to experience Discovery Summit Europe at our best available rate! Early bird registration through 31 Oct.
  • Graph Builder Toolbar streamlines interactive graphing. Creates shortcuts on Report and GraphBuilder Helpers toolbars. Download and install the extension.

JMP Wish List

We want to hear your ideas for improving JMP. Share them here.
Choose Language Hide Translation Bar

Graph Builder - Overlay by multiple columns

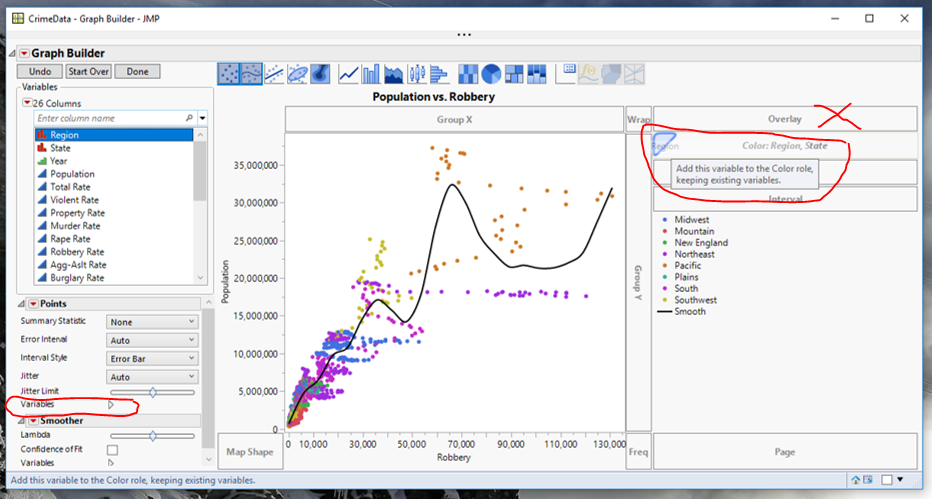
I would like to have Graph Builder be able to Overlay by several variables in the same way that x, y or color drop-zones can take several variables. This would allow overlay to be selected/deselected from the "Variables" group under each graph type and create much more complex and rich visualizations.
21 Comments
morenopelaez_p
Level III

Still my top wish for 2019, 2020, 2021, 2022, 2023, 2024 :)

hogi
Level XIII

: )

hogi
Level XIII

: (

MathStatChem
Level VII

see Create Curve Plots with Overall Average Curve and Individual Replicate Curves , this requested feature would enable this, I think.  Would need to allow that any display element could choose any or all of the overlay variables for aggregation.  

hogi
Level XIII
hogi
Level XIII
BHarris
Level VII

Most of the drop zones accept multiple variables.  I'm starting to wonder why Xan et al. would have left Overlay out -- is there some reason we're missing for why it doesn't make sense to do this?

hogi
Level XIII

@XanGregg , any chance to get Overlay by multiple column into a future version of JMP?

Why is it not possible to generate this graph in JMP? 

hogi_0-1771447550482.png

Agree, this plot looks strange. Who seriously wants to know—at the same time—which sex prefers which car and which age group? Especially considering that parents choose the car, not the students.

Now—cut to reality: in the semiconductor industry, multiple overlays are a completely different story.

Believe me: Here, multiple overlays will be a game changer for Graph Builder. Semiconductor data is inherently multi‑dimensional—lots, wafers, tools, quality data, yield, parameters. The ability to overlay these dimensions in a single, consistent view is not a nice‑to‑have; it is essential for understanding variation, drift, and interactions.


XanGregg
Staff

Thanks for continuing to advocate for this feature, @hogi and @BHarris . Yes, it is possible and on my shortlist. There are some architectural challenges since having only one overlay variable has allowed certain optimizations to be baked in. However, for tables under a few thousand rows, the optimizations are probably undetectable. 

hogi
Level XIII