- New to JMP? Let the Data Analysis Director guide you through selecting an analysis task, an analysis goal, and a data type. Available now in the JMP Marketplace!
- See how to install JMP Marketplace extensions to customize and enhance JMP.
- Subscribe to RSS Feed
- Mark Topic as New
- Mark Topic as Read
- Float this Topic for Current User
- Bookmark
- Subscribe
- Mute
- Printer Friendly Page
Discussions
Solve problems, and share tips and tricks with other JMP users.- JMP User Community
- :
- Discussions
- :
- how to connect points with lines in graph builder?

- Mark as New
- Bookmark
- Subscribe
- Mute
- Subscribe to RSS Feed
- Get Direct Link
- Report Inappropriate Content
how to connect points with lines in graph builder?
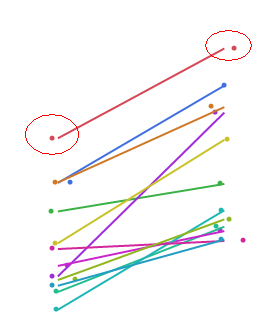
In graph builder,After plotting the "Points",how to connect points with lines?I knew use "Smoother" or "Lines" to plot lines, but the lines don't connect the points. Just like the attached picture.

- Mark as New
- Bookmark
- Subscribe
- Mute
- Subscribe to RSS Feed
- Get Direct Link
- Report Inappropriate Content
Re: how to connect points with lines in graph builder?
Thanks! I found the same cause and solution. Dragging the group identifier column over to the overlay field (or to the legend space) instead of the color field in graph builder and adding a line gives the desired result:


- Mark as New
- Bookmark
- Subscribe
- Mute
- Subscribe to RSS Feed
- Get Direct Link
- Report Inappropriate Content
Re: how to connect points with lines in graph builder?
It was only recently that I realized that "Overlay" is likely a reference to the old days when we had overhead projectors. You could print a plot on an overhead slide (acetate sheet), and then print a different plot on a different slide, and then "overlay" them and make them look like they were plotted on top of each other. In your case, each line/recipe combination gets its own slide, and the lines break appropriately.

- Mark as New
- Bookmark
- Subscribe
- Mute
- Subscribe to RSS Feed
- Get Direct Link
- Report Inappropriate Content
Re: how to connect points with lines in graph builder?
I am facing the same issue.

- Mark as New
- Bookmark
- Subscribe
- Mute
- Subscribe to RSS Feed
- Get Direct Link
- Report Inappropriate Content
Re: how to connect points with lines in graph builder?
I want individual points to connect, not their mean.
There are 4 Y's for each X. I want all Y1`'s across X to connect, then the Y2's across X, and so on ....in the plot below. In the plot below there are multiple lines for every 'analyte_level 2'; i want each line's dots connected.

- « Previous
-
- 1
- 2
- Next »
Recommended Articles
- © 2026 JMP Statistical Discovery LLC. All Rights Reserved.
- Terms of Use
- Privacy Statement
- Contact Us