- JMP will suspend normal business operations for our Winter Holiday beginning on Wednesday, Dec. 24, 2025, at 5:00 p.m. ET (2:00 p.m. ET for JMP Accounts Receivable).
Regular business hours will resume at 9:00 a.m. EST on Friday, Jan. 2, 2026. - We’re retiring the File Exchange at the end of this year. The JMP Marketplace is now your destination for add-ins and extensions.
- Subscribe to RSS Feed
- Mark Topic as New
- Mark Topic as Read
- Float this Topic for Current User
- Bookmark
- Subscribe
- Mute
- Printer Friendly Page
Discussions
Solve problems, and share tips and tricks with other JMP users.- JMP User Community
- :
- Discussions
- :
- excluded datapoints in graph builder

- Mark as New
- Bookmark
- Subscribe
- Mute
- Subscribe to RSS Feed
- Get Direct Link
- Report Inappropriate Content
excluded datapoints in graph builder
The option to "exclude" datapoints does not seem to work as expected when creating plots with the Graph builder. According to the manual:
"Note: Excluded data are not automatically hidden in plots even though they are excluded from calculations in text reports and graphs.
 The attached example shows a number of data points where the fourth is "excluded".
Accepted Solutions

- Mark as New
- Bookmark
- Subscribe
- Mute
- Subscribe to RSS Feed
- Get Direct Link
- Report Inappropriate Content
Re: excluded datapoints in graph builder
I found this in the documentation
Help==>Books==>Essential Graphing
in the Graph Builder chapter
The graph area and zones are the main body of Graph Builder. Your graph appears in the middle, and you drag variables into different zones. See “Graph Zones” on page93.
Note: Any excluded rows are hidden in graphs.
- Mark as New
- Bookmark
- Subscribe
- Mute
- Subscribe to RSS Feed
- Get Direct Link
- Report Inappropriate Content
Re: excluded datapoints in graph builder
Thank you. That means it is meant to be this way. (I still think it's not consitent and therefore confusing.)
In that case it might be helpful to update the help section in

- Mark as New
- Bookmark
- Subscribe
- Mute
- Subscribe to RSS Feed
- Get Direct Link
- Report Inappropriate Content
Re: excluded datapoints in graph builder
Hi @matthias_bruchh,
It's been some time since you posted, but your post was mentioned in another discussion just recently. In case it's still helpful, I wanted to let you know that there is a hidden option to show excluded rows in Graph Builder: while holding shift, click the Red Triangle > Show Excluded Rows. The excluded rows will now show on your plot as slightly transparent.


- Mark as New
- Bookmark
- Subscribe
- Mute
- Subscribe to RSS Feed
- Get Direct Link
- Report Inappropriate Content
Re: excluded datapoints in graph builder

- Mark as New
- Bookmark
- Subscribe
- Mute
- Subscribe to RSS Feed
- Get Direct Link
- Report Inappropriate Content
Re: excluded datapoints in graph builder
Hello -
Does the Shift-click option to reveal excluded rows still work as expected in JMP v14? I'm using JMP v14.3 and when I exclude data the data points (within GraphBuilder) and then select the "show excluded" the selected data points remain invisible.
- Mark as New
- Bookmark
- Subscribe
- Mute
- Subscribe to RSS Feed
- Get Direct Link
- Report Inappropriate Content
Re: excluded datapoints in graph builder
Hi @AxelFoolery,
"Show Excluded" works as expected for me in JMP 14 and 15. Is it possible that your rows are both excluded and hidden? Hidden rows will never be shown in Graph Builder even if "Show Excluded" is toggled.

- Mark as New
- Bookmark
- Subscribe
- Mute
- Subscribe to RSS Feed
- Get Direct Link
- Report Inappropriate Content
Re: excluded datapoints in graph builder
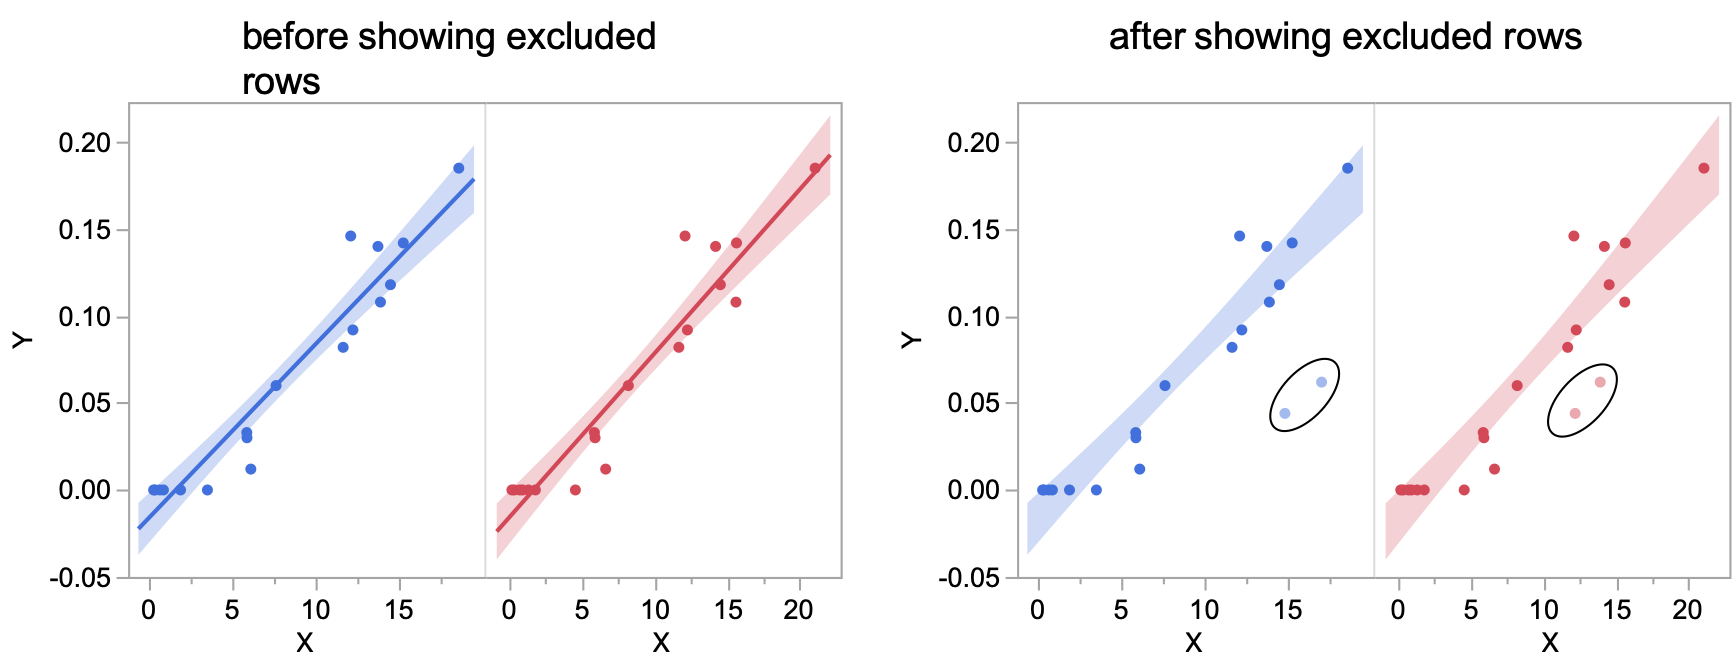
From the drop-down menu, if I click on 'show excluded rows', the line fits disappear from the graph builder plots; only the confidence interval regions show up, but not the line fits. Attached here are plots before and after showing the excluded rows. I would like to have the line fits (solid lines) as well as confidence interval regions to be in the plots while those data points excluded from fitting should still be shown in the plots. Any help is much appreciated.

- Mark as New
- Bookmark
- Subscribe
- Mute
- Subscribe to RSS Feed
- Get Direct Link
- Report Inappropriate Content
Re: excluded datapoints in graph builder
Are you joking me? A hidden menu option to get graph builder to show excluded data points? If I wanted them hidden I would have hidden them?
And since they shouldn't be hidden, why hide the option to turn them on?
Maybe the answer is to just give us back the Overlay Plot platform.
Recommended Articles
- © 2025 JMP Statistical Discovery LLC. All Rights Reserved.
- Terms of Use
- Privacy Statement
- Contact Us