- Subscribe to RSS Feed
- Mark Topic as New
- Mark Topic as Read
- Float this Topic for Current User
- Bookmark
- Subscribe
- Mute
- Printer Friendly Page
Discussions
Solve problems, and share tips and tricks with other JMP users.- JMP User Community
- :
- Discussions
- :
- Re: categorical response analysis report show percentage of response for each re...
- Mark as New
- Bookmark
- Subscribe
- Mute
- Subscribe to RSS Feed
- Get Direct Link
- Report Inappropriate Content
categorical response analysis report show percentage of response for each response value
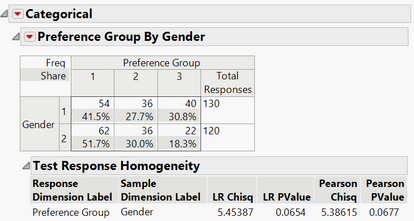
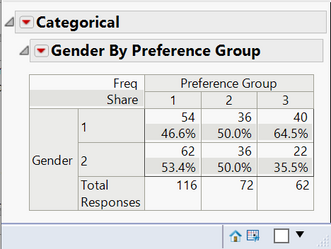
Under categorical response analysis report, how can I show percentage of response for each response value. For example (see the report below), how to include percentage of response for each preference group (1, 2, or 3), i.e. calculate column-wise percentage. Thanks.
Accepted Solutions
- Mark as New
- Bookmark
- Subscribe
- Mute
- Subscribe to RSS Feed
- Get Direct Link
- Report Inappropriate Content
Re: categorical response analysis report show percentage of response for each response value
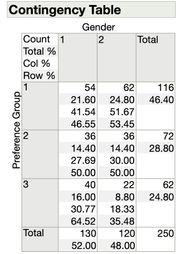
Ah, so right...since preference group is your response all %s are calculated in terms of the preference group. To get the %s in terms of gender either swap your response and grouping variable or use Fit Y by X to get a full contingency table.
- Mark as New
- Bookmark
- Subscribe
- Mute
- Subscribe to RSS Feed
- Get Direct Link
- Report Inappropriate Content
Re: categorical response analysis report show percentage of response for each response value
- Mark as New
- Bookmark
- Subscribe
- Mute
- Subscribe to RSS Feed
- Get Direct Link
- Report Inappropriate Content
Re: categorical response analysis report show percentage of response for each response value
- Mark as New
- Bookmark
- Subscribe
- Mute
- Subscribe to RSS Feed
- Get Direct Link
- Report Inappropriate Content
Re: categorical response analysis report show percentage of response for each response value
Thanks @KarenC. However "crosstab transposed" doesn't give me what I wanted. It simply transposed the table. What I want is to get percentage of response for each gender by each preference group (1, 2, or 3), i.e. calculate column-wise percentage. For example, the % number in the 1-1 cell should be 54/(54+62)=46.55%.
- Mark as New
- Bookmark
- Subscribe
- Mute
- Subscribe to RSS Feed
- Get Direct Link
- Report Inappropriate Content
Re: categorical response analysis report show percentage of response for each response value
Ah, so right...since preference group is your response all %s are calculated in terms of the preference group. To get the %s in terms of gender either swap your response and grouping variable or use Fit Y by X to get a full contingency table.
- Mark as New
- Bookmark
- Subscribe
- Mute
- Subscribe to RSS Feed
- Get Direct Link
- Report Inappropriate Content
Re: categorical response analysis report show percentage of response for each response value
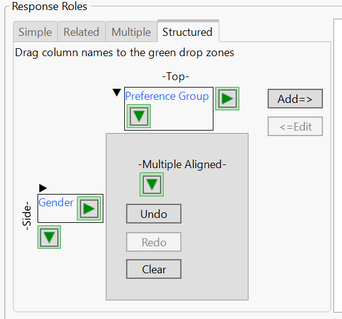
or....to stay in categorical use the structured tab:
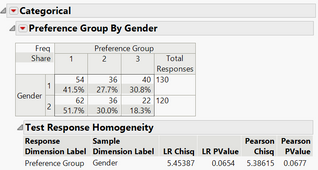
to get....
- Mark as New
- Bookmark
- Subscribe
- Mute
- Subscribe to RSS Feed
- Get Direct Link
- Report Inappropriate Content
Re: categorical response analysis report show percentage of response for each response value
Thanks, @KarenC. Fit Y by X or the Structured Tab in Consumer Research > Categorical solves my problem.
Recommended Articles
- © 2026 JMP Statistical Discovery LLC. All Rights Reserved.
- Terms of Use
- Privacy Statement
- Contact Us
