- Learn how to build custom Python data connectors and further customize JMP’s Data Connector Framework with the Python Data Connector Demo, available now in the JMP Marketplace!
- See how to create experiments to support product design and ID useful product features. Register for June 12 webinar, 2pm US Eastern Time.
- Subscribe to RSS Feed
- Mark Topic as New
- Mark Topic as Read
- Float this Topic for Current User
- Bookmark
- Subscribe
- Mute
- Printer Friendly Page
Discussions
Solve problems, and share tips and tricks with other JMP users.- JMP User Community
- :
- Discussions
- :
- Re: Work algorithm for Normal data & Non normal. Non Normal Data (Abnormal Distr...

- Mark as New
- Bookmark
- Subscribe
- Mute
- Subscribe to RSS Feed
- Get Direct Link
- Report Inappropriate Content
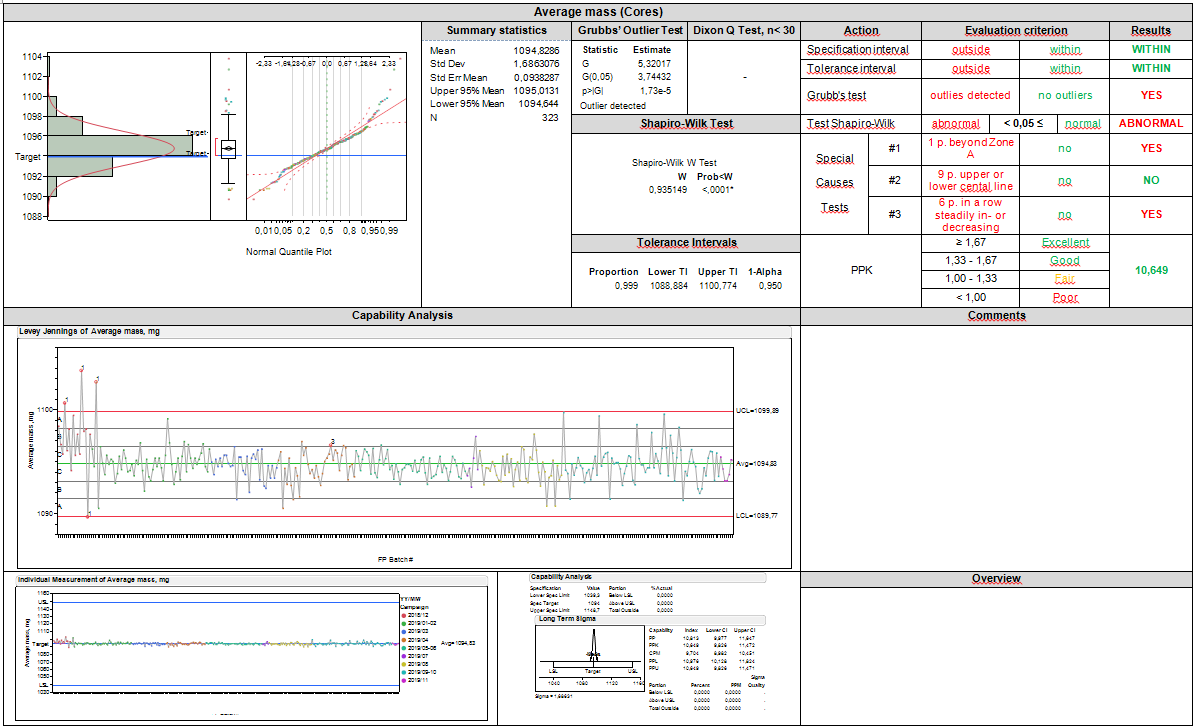
Work algorithm for Normal data & Non normal. Non Normal Data (Abnormal Distribution). PP/PPK. Levey Jennings Control Chart.
Hi everyone!
I analyze the statistics that arise during the production and packaging of tablets (pills).
Data analysis is performed in several steps.
- Detecting outliers (Grubb's test)
- Determining, if the distribution is normal (Shapiro-Wilk test)
- Tolerant intervals
- Plotting the Levey Jennings graph, PP/PPK
- Turn on the test for the first 3 special reasons
Sometimes there are errors in entering data, sometimes the problem is in the methodology. Of course, this affects the distribution. We find the reasons.
But sometimes the data is not normal, in principle. It can be not symmetrical. One time it hided mixture of 2 normal distributions and so on...
In JMP, as I understand, your can check, what distribution is closer to yours (FIT ALL).
(1) The standard calculation PP/PPK is not suitable for an abnormal distribution, is it?
Ok, we recalculate PPK using percentile method (it uses median, not average (by JMP)
(2) But what about graph. Which chart should I use, to receive UCL & LCL for Non normal data?
I came to the conclusion that and graph must calculate UCL & LCL also from median.
I use Levey Jennings with fixed average equal to the median.
Sometimes median and average are very close, and the difference between borders is almost not felt. But there are also differences. (3) Or, is it enough to recalculate the PPK and plot usual Levey Jennings chart using average and use testing for special causes? (4) Or maybe non normal data can't be tested in such way?
*P.S. XBar, IMR I don't use for today, for this year. We are at the beginning of applying statistical methods. Сauses that are not visible in the routine process are revealed and eliminated.
Please help me answer the questions in bold. (1-4)
Please give a rating to my method.
Offer your work algorithm for Normal data & Non normal
Thank you in advance!!!
Accepted Solutions

- Mark as New
- Bookmark
- Subscribe
- Mute
- Subscribe to RSS Feed
- Get Direct Link
- Report Inappropriate Content
Re: Work algorithm for Normal data & Non normal. Non Normal Data (Abnormal Distribution). PP/PPK. Levey Jennings Control Chart.
T
To begin with, you have a really sweet looking report, and
If its alright with you, lets try to tackle one thing at a time.
Given that you have some number of tablets in each sample and multiple samples per campaign and multiple campaigns per APR.
I can understand @gzmorgan0 's comment about a variance type report, it would be a smart thing. But how to do that in this context?
It might be a good idea to get the table with all of the individual individual tablet weights:
These Columns: Campaign, Sample, Weight. Use an X-bar chart with R charts for between and within variation (three way chart) I suspect this will fix the overly tight control limit issue that you might have originally seen with an x-bar chart that caused the selection of Levey Jennings charts. In the x-bar chart use campaign as a Phase variable.
That chart might look like this:

The second control chart might compare the average sample weight to a historical, fixed, control limit from a time when the process was stable and in control. This is not a three standard deviation control limit, but a 3 sigma limit base on the moving range, normal control chart limits.
That chart might look like this.

Now about normality and control charts.
I'm about to get "Wheeler" on you. You can definitely plot non-normal data on a control chart without normalizing it (with exceptions for very lognormal data from something like a biologic potency test.)
The distribution model matters for Ppk but not for control charts. Ppk is baed on the ratio of 3 standard deviation between the spec limit and the process mean. If your data is not normal, then using standard deviation, which assumes your data is independent and identically distributed is going to give you inaccurate Ppk estimates.
The tolerance interval is a curious criteria to apply. An interval with alpha 0.95 and proportion 0.99... is saying I'm 95% sure 1% of the tablet weights will be outside this range. You'll have to check this for yourself, and without getting into it, 3 sigma is always within that interval. I don't know the rationale behind including it in the report, I'm sure its interesting. By culling thel "outliers", the data will fit into those limits most of the time; however, If I was auditing your facility and I saw that your tablet weight consistency was based on data with the outliers removed before reporting, that would open the door for a lot of other exploration. It might be better to report all the data and means of the samples, just like in an x-bar chart?
- Mark as New
- Bookmark
- Subscribe
- Mute
- Subscribe to RSS Feed
- Get Direct Link
- Report Inappropriate Content
Re: Work algorithm for Normal data & Non normal. Non Normal Data (Abnormal Distribution). PP/PPK. Levey Jennings Control Chart.
Are you trending individual tablets, or the mean/median of a subgroup of tablets?
What are you using as a reference for this Statistical Process Control method?
How are the tolerance intervals being used?
- Mark as New
- Bookmark
- Subscribe
- Mute
- Subscribe to RSS Feed
- Get Direct Link
- Report Inappropriate Content
Re: Work algorithm for Normal data & Non normal. Non Normal Data (Abnormal Distribution). PP/PPK. Levey Jennings Control Chart.
2. We have spec limits and target. We need to evaluate the outliers, distribution, PPK, special causes.
3. Tolerance inrevals must fit within the specification limits, not outside.
- Mark as New
- Bookmark
- Subscribe
- Mute
- Subscribe to RSS Feed
- Get Direct Link
- Report Inappropriate Content
Re: Work algorithm for Normal data & Non normal. Non Normal Data (Abnormal Distribution). PP/PPK. Levey Jennings Control Chart.
**I also need to add that the series are combined in campaigns and distributions in campaings sometimes are normal, sometimes are weibull. But my task is to evaluate the process for a year, which consists of several campaigns.

- Mark as New
- Bookmark
- Subscribe
- Mute
- Subscribe to RSS Feed
- Get Direct Link
- Report Inappropriate Content
Re: Work algorithm for Normal data & Non normal. Non Normal Data (Abnormal Distribution). PP/PPK. Levey Jennings Control Chart.
Just a few comments:
- I do not know what a campaign happens to be, however, i see more campaign-to-campaign variation than within campaign. Most campaigns demonstrate a baseline stability, but a new campaign often looks like a shift.
- Campaigns 201909 and 201903-04 are unstable, out of control.
A goal of a control chart is rapid detection of a change. Your question regarding control limits seems strange to me. The picture you provided looks like a standard report. I suggest a little exploration, before making a report or dashboard change.
Make another Levey Jennings chart and specify campaign as Phase and request a process sigma report. This will quantify the within campaign (sample to sample) variation, and should highlight that the March-April and September campaigns were not the same, unstable for whaever reason, compared to other campaigns.
I worked in a manufacturing plant with many processing tools and incoming chemicals. Control limits calculated to accomodate smal tolerable shifts due to tool parts change outs or chemical batches can be too wide to identify problems within a campaign. A recommendation that quickly flags issues,is not easy to implement.
- When a known change is made, a new campaign, the average of the first 2-3 samples if they are within some tolerance value, are used to reset the centerline of the active control chart. The upper and lower control limits, UCL and LCL, respectivlety are set at + k sigma (typically k is 3), where sigma is the baseline within campaign std dev.
- For the data you displayed, I'd likely pool the variance(weighted average sum of squares) and take the square root as the baseline std dev
However, you stated "my task is to evaluate the process for a year, which consists of several campaigns".
My suggestion is do a variance components type report. The control chart is great to display the variation, but I would report:
- Distribution of sample data.
- Levey Jennings chart with Campaign specified as Phase. Report the range and std dev of campaign to campaign averages (campaign center lines)
- Report the two anomalous campaigns sample to sample variation, and use the pooled/stable sample to sample variation.
- Report the within sample variation. This was not clearly explained if you take x (30?) pills and each pill is tested y (10?) times?? If yes then you have test to test variation and pill-to-to-pill
- Regarding capability, it depends upon your industry, but as @Byron_JMP indicated, it seems if multiple tests on the same pill are taken, that pill's avg or trimmed mean of tests on that pill represent that pill's value. And each pill's value would be used for capability analysis, likely using the percentile method.
Calculation methods often are industry specific, and agreed upon by producer and customer. So this note is just a suggestion of other ways to look at your data. Note: I do not have experience in the production of pills.
- Mark as New
- Bookmark
- Subscribe
- Mute
- Subscribe to RSS Feed
- Get Direct Link
- Report Inappropriate Content
Re: Work algorithm for Normal data & Non normal. Non Normal Data (Abnormal Distribution). PP/PPK. Levey Jennings Control Chart.
T
To begin with, you have a really sweet looking report, and
If its alright with you, lets try to tackle one thing at a time.
Given that you have some number of tablets in each sample and multiple samples per campaign and multiple campaigns per APR.
I can understand @gzmorgan0 's comment about a variance type report, it would be a smart thing. But how to do that in this context?
It might be a good idea to get the table with all of the individual individual tablet weights:
These Columns: Campaign, Sample, Weight. Use an X-bar chart with R charts for between and within variation (three way chart) I suspect this will fix the overly tight control limit issue that you might have originally seen with an x-bar chart that caused the selection of Levey Jennings charts. In the x-bar chart use campaign as a Phase variable.
That chart might look like this:
The second control chart might compare the average sample weight to a historical, fixed, control limit from a time when the process was stable and in control. This is not a three standard deviation control limit, but a 3 sigma limit base on the moving range, normal control chart limits.
That chart might look like this.
Now about normality and control charts.
I'm about to get "Wheeler" on you. You can definitely plot non-normal data on a control chart without normalizing it (with exceptions for very lognormal data from something like a biologic potency test.)
The distribution model matters for Ppk but not for control charts. Ppk is baed on the ratio of 3 standard deviation between the spec limit and the process mean. If your data is not normal, then using standard deviation, which assumes your data is independent and identically distributed is going to give you inaccurate Ppk estimates.
The tolerance interval is a curious criteria to apply. An interval with alpha 0.95 and proportion 0.99... is saying I'm 95% sure 1% of the tablet weights will be outside this range. You'll have to check this for yourself, and without getting into it, 3 sigma is always within that interval. I don't know the rationale behind including it in the report, I'm sure its interesting. By culling thel "outliers", the data will fit into those limits most of the time; however, If I was auditing your facility and I saw that your tablet weight consistency was based on data with the outliers removed before reporting, that would open the door for a lot of other exploration. It might be better to report all the data and means of the samples, just like in an x-bar chart?
- Mark as New
- Bookmark
- Subscribe
- Mute
- Subscribe to RSS Feed
- Get Direct Link
- Report Inappropriate Content
Re: Work algorithm for Normal data & Non normal. Non Normal Data (Abnormal Distribution). PP/PPK. Levey Jennings Control Chart.
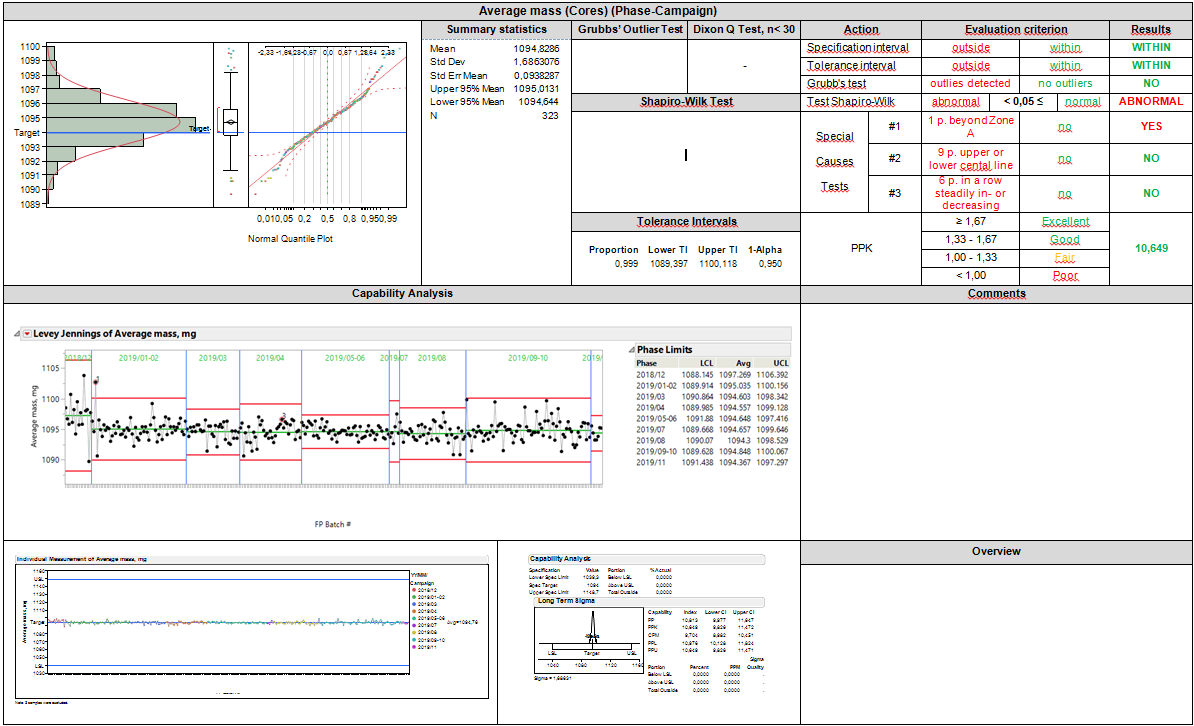
I thought I was going crazy and no one understands me, but no thank you for coming to help. You've opened my eyes. Yes, my process has its own specifics. This is a shift between compaigns. Campaign, campaign, campaign....I think it is correct to test for special causes each campaign individually
Take a look for screenshot BEFORE/AFTER
Please help me answer next questions:
1. Do I have to calculate PPK for each phase / campaign or do I have the right and it is legal)) to calculate PPK for all data (all campaigns for the year)?
2. Same question about distribution
- Mark as New
- Bookmark
- Subscribe
- Mute
- Subscribe to RSS Feed
- Get Direct Link
- Report Inappropriate Content
Re: Work algorithm for Normal data & Non normal. Non Normal Data (Abnormal Distribution). PP/PPK. Levey Jennings Control Chart.
@Byron_JMP : The tolerance interval is a curious criteria to apply. An interval with alpha 0.95 and proportion 0.99... is saying I'm 95% sure 1% of the tablet weights will be outside this range.

You cannot set proportion to 1.0 (100%). The nearest is 0.999
Recommended Articles
- © 2026 JMP Statistical Discovery LLC. All Rights Reserved.
- Terms of Use
- Privacy Statement
- Contact Us