Turn on suggestions
Auto-suggest helps you quickly narrow down your search results by suggesting possible matches as you type.
- JMP will suspend normal business operations for our Winter Holiday beginning on Wednesday, Dec. 24, 2025, at 5:00 p.m. ET (2:00 p.m. ET for JMP Accounts Receivable).
Regular business hours will resume at 9:00 a.m. EST on Friday, Jan. 2, 2026. - We’re retiring the File Exchange at the end of this year. The JMP Marketplace is now your destination for add-ins and extensions.
Options
- Subscribe to RSS Feed
- Mark Topic as New
- Mark Topic as Read
- Float this Topic for Current User
- Bookmark
- Subscribe
- Mute
- Printer Friendly Page
Discussions
Solve problems, and share tips and tricks with other JMP users.- JMP User Community
- :
- Discussions
- :
- Ternary Plots with Tie Lines

Level I
- Mark as New
- Bookmark
- Subscribe
- Mute
- Subscribe to RSS Feed
- Get Direct Link
- Report Inappropriate Content
Ternary Plots with Tie Lines
Oct 30, 2023 03:57 PM
(1758 views)
Hi all,
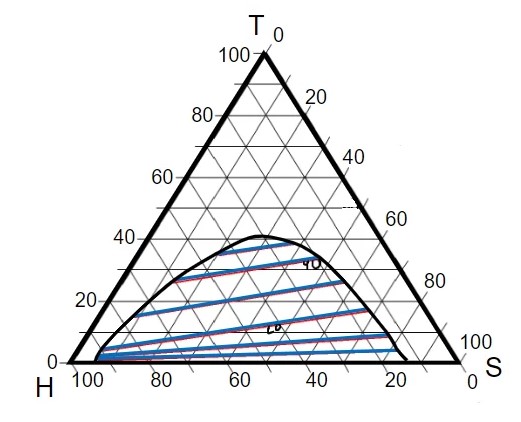
I am trying to build a three liquid equilibrium diagram with tie-lines. I am able to get my data for the phase envelope but cannot figure out how to add the tie lines.
I am using Windows JMP16.20.
Thanks!
- Tags:
- windows
1 REPLY 1

Staff
- Mark as New
- Bookmark
- Subscribe
- Mute
- Subscribe to RSS Feed
- Get Direct Link
- Report Inappropriate Content
Re: Ternary Plots with Tie Lines
You need to have a formula column with a model that describes the "tie lines" or contours, as they would be called in JMP. See the attached example.
Graph > Mixture Profiler. Add your formula column in Y, Prediction Formula and click ok. Then look in the Mixture Profiler red triangle menu for the various options to define the contours and other aspects of the appearance.
I hope this helps,
Phil

Recommended Articles
- © 2025 JMP Statistical Discovery LLC. All Rights Reserved.
- Terms of Use
- Privacy Statement
- Contact Us