cancel
Showing results for 
Show  only  | Search instead for 
Did you mean: 
  • Don’t miss your chance to experience Discovery Summit Europe at our best available rate! Early bird registration through 31 Oct.
  • Graph Builder Toolbar streamlines interactive graphing. Creates shortcuts on Report and GraphBuilder Helpers toolbars. Download and install the extension.
  • JMP will suspend normal business operations for our Rest and Recharge Day on Friday, October 2, 2026.
    Regular business hours will resume on Monday, October 5, 2026.

Discussions

Solve problems, and share tips and tricks with other JMP users.
Choose Language Hide Translation Bar

Ternary Plots with Tie Lines

Hi all,

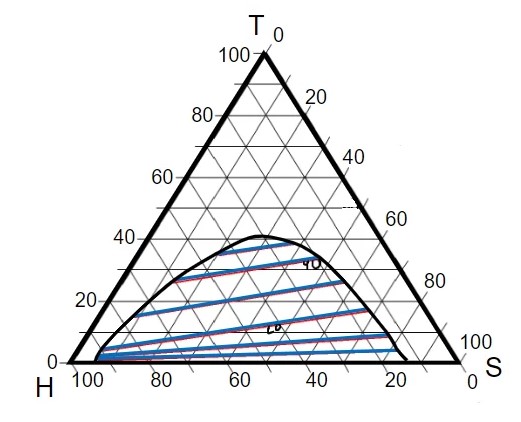
I am trying to build a three liquid equilibrium diagram with tie-lines.  I am able to get my data for the phase envelope but cannot figure out how to add the tie lines.  


I am using Windows JMP16.20.


Thanks!

1 REPLY 1
Phil_Kay
Staff

Re: Ternary Plots with Tie Lines

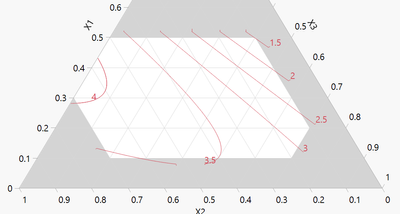
You need to have a formula column with a model that describes the "tie lines" or contours, as they would be called in JMP. See the attached example.

Graph > Mixture Profiler. Add your formula column in Y, Prediction Formula and click ok. Then look in the Mixture Profiler red triangle menu for the various options to define the contours and other aspects of the appearance.

I hope this helps,
Phil
 

Phil_Kay_0-1698748776718.png


Recommended Articles