- New to JMP? Join us Sept. 23-24 for the Early User Edition of Discovery Summit, tailor-made for new users. Register now for free!
- Use World Cup data to build models, explore spatial relationships, and create informative visualizations in JMP. Register. July 17, 2 pm US Eastern Time.
- Your voice matters! Tell us how you prefer to receive JMP updates, so we can tailor our communication to your needs. Take short survey.
- Subscribe to RSS Feed
- Mark Topic as New
- Mark Topic as Read
- Float this Topic for Current User
- Bookmark
- Subscribe
- Mute
- Printer Friendly Page
Discussions
Solve problems, and share tips and tricks with other JMP users.- JMP User Community
- :
- Discussions
- :
- Re: Shading a specific time (weekends) in graph builder

- Mark as New
- Bookmark
- Subscribe
- Mute
- Subscribe to RSS Feed
- Get Direct Link
- Report Inappropriate Content
Shading a specific time (weekends) in graph builder
Hello, I am working on a graph looking at cyclical trends and was wondering, is there any way to apply shading to specific days/times in graph builder to draw attention to the specific ranges? I have attached an example image of what I'm trying to do below, where I added shading to the weekends in a photo editing platform.
Thank you!
Accepted Solutions


- Mark as New
- Bookmark
- Subscribe
- Mute
- Subscribe to RSS Feed
- Get Direct Link
- Report Inappropriate Content
Re: Shading a specific time (weekends) in graph builder
As you didn't provide data I will use jmp's steel shipments as example. Create new column which indicates weekends
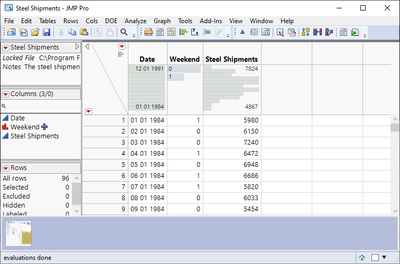
You can then use this column as color in graph builder
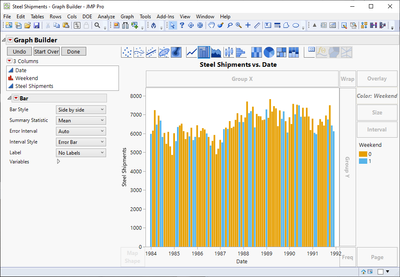
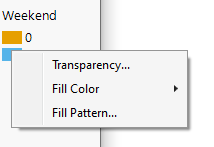
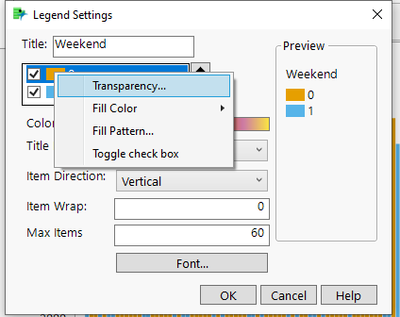
You can then change the colors / transparency from legend settings
Also I'm fairly sure I have seen Scott Wise do something like this (https://community.jmp.com/t5/Scott-Wise-s-Blog/bg-p/swise-blog) but couldn't quickly find it.
Edit:
One thing to note about my solution is that it isn't really adding "shading". It will recolor your bars and sometimes that might not be what you want. For shading type of tasks the other options here are better
- Mark as New
- Bookmark
- Subscribe
- Mute
- Subscribe to RSS Feed
- Get Direct Link
- Report Inappropriate Content
Re: Shading a specific time (weekends) in graph builder
As you didn't provide data I will use jmp's steel shipments as example. Create new column which indicates weekends
You can then use this column as color in graph builder
You can then change the colors / transparency from legend settings
Also I'm fairly sure I have seen Scott Wise do something like this (https://community.jmp.com/t5/Scott-Wise-s-Blog/bg-p/swise-blog) but couldn't quickly find it.
Edit:
One thing to note about my solution is that it isn't really adding "shading". It will recolor your bars and sometimes that might not be what you want. For shading type of tasks the other options here are better
- Mark as New
- Bookmark
- Subscribe
- Mute
- Subscribe to RSS Feed
- Get Direct Link
- Report Inappropriate Content
Re: Shading a specific time (weekends) in graph builder
Fantastic, thank you for the prompt reply and instruction!


- Mark as New
- Bookmark
- Subscribe
- Mute
- Subscribe to RSS Feed
- Get Direct Link
- Report Inappropriate Content
Re: Shading a specific time (weekends) in graph builder
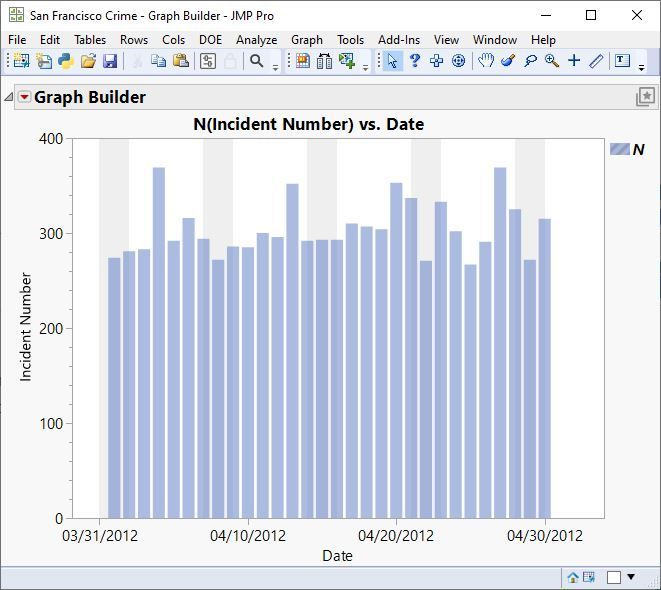
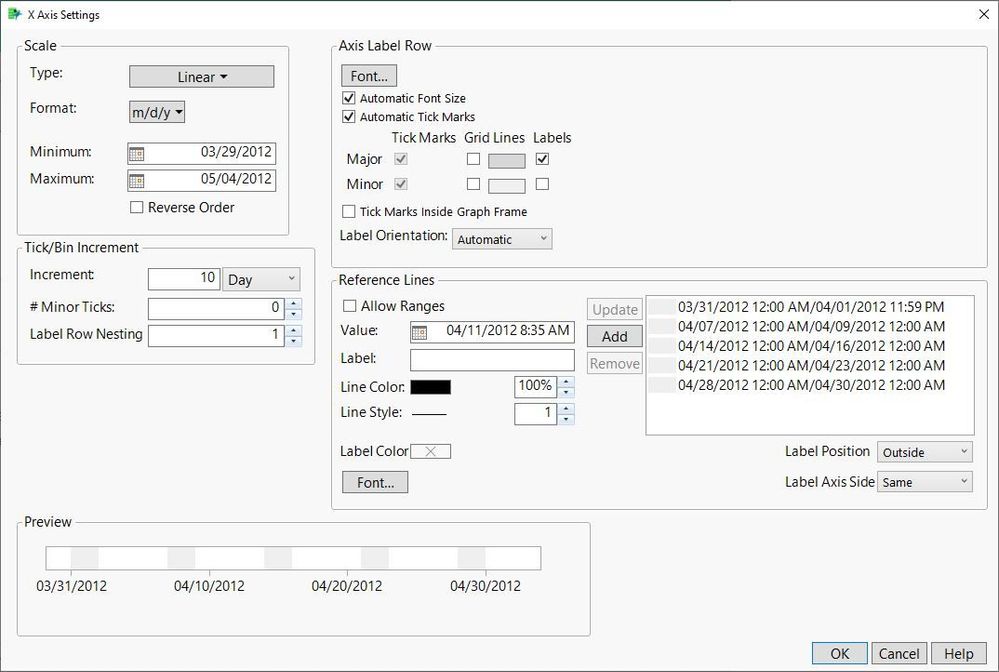
You can add Reference Lines to the time axis that span a range of values. See the example below and the axis dialog box.

- Mark as New
- Bookmark
- Subscribe
- Mute
- Subscribe to RSS Feed
- Get Direct Link
- Report Inappropriate Content
Re: Shading a specific time (weekends) in graph builder
Reference lines are nice for 1-100 regions.
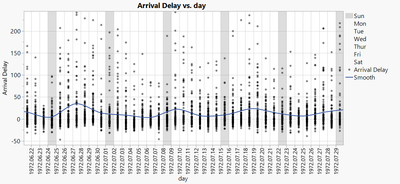
Beyond that, you could use Heatmap to get the weekends shaded fully automatically.
Nice tutorial by @John_Powell_JMP :
dt = Open( "$SAMPLE_DATA/Airline Delays.jmp" );
New Column( "day",
	Format( "y/m/d", 12 ),
	Formula(
		Date DMY(
			:Day of Month,
			Match( :Month,"Jan", 1,"Feb", 2,"Mar", 3,"Apr", 4,"May", 5,	"Jun", 6,"Jul", 7,"Aug", 8,	"Sep", 9,"Oct", 10, "Nov", 11, "Dec", 12
			),
			1972
		) + In Hours( 12 )
	)
);
Graph Builder(
	Variables( X( :day ), Y( :Arrival Delay ), Color( :Day of Week ) ),
	Elements(
		Heatmap( X, Legend( 9 ) ),
		Points( X, Y, Color( 0 ), Legend( 7 ) )
	),
	SendToReport(
		Dispatch( {}, "400", ScaleBox,
			{Legend Model(
				9,
				Properties(
					0,
					{Fill Color( 16 ), Transparency( 0.2 )},
					Item ID( "Sun", 1 )
				),
				Properties( 1, {Transparency( 0 )}, Item ID( "Mon", 1 ) ),
				Properties( 2, {Transparency( 0 )}, Item ID( "Tue", 1 ) ),
				Properties( 3, {Transparency( 0 )}, Item ID( "Wed", 1 ) ),
				Properties( 4, {Transparency( 0 )}, Item ID( "Thur", 1 ) ),
				Properties( 5, {Transparency( 0 )}, Item ID( "Fri", 1 ) ),
				Properties( 6, {Transparency( 0 )}, Item ID( "Sat", 1 ) )
			)}
		)
	)
);- Mark as New
- Bookmark
- Subscribe
- Mute
- Subscribe to RSS Feed
- Get Direct Link
- Report Inappropriate Content
Re: Shading a specific time (weekends) in graph builder
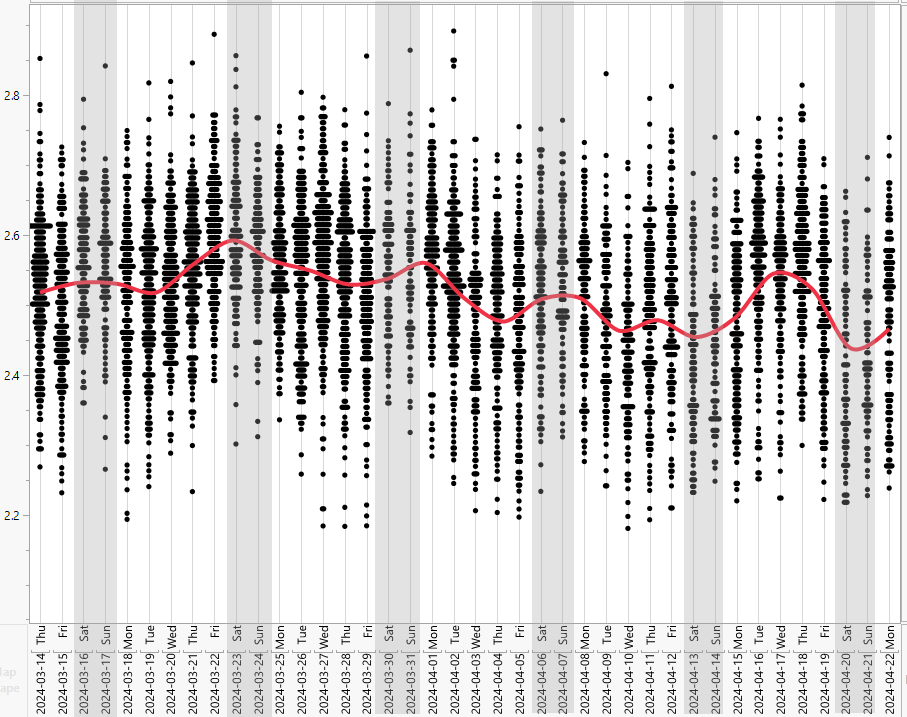
The auto-adjustment of the tick spacing in GraphBuilder reduces the usefulness of the Heatmap approach - once you adjusted the tick spacing, don't dare to zoom in or out:
So, for Jmp <=18 it's better to use @Mark_Bailey's approach - even for N>100 : ):)
Concerning a future version of Jmp - there is already a wish to fix the issue:
Heatmap - option: fixed Tick spacing (aggregation area)
Recommended Articles
- © 2026 JMP Statistical Discovery LLC. All Rights Reserved.
- Terms of Use
- Privacy Statement
- Contact Us