- Learn how to build custom Python data connectors and further customize JMP’s Data Connector Framework with the Python Data Connector Demo, available now in the JMP Marketplace!
- See how to move from signal modeling to system modeling at the first JMP Aerospace Analytics webinar. Register. June 18, 1 p.m. US Eastern Time.
- Subscribe to RSS Feed
- Mark Topic as New
- Mark Topic as Read
- Float this Topic for Current User
- Bookmark
- Subscribe
- Mute
- Printer Friendly Page
Discussions
Solve problems, and share tips and tricks with other JMP users.- JMP User Community
- :
- Discussions
- :
- Re: Response surface VS Mixture response surface

- Mark as New
- Bookmark
- Subscribe
- Mute
- Subscribe to RSS Feed
- Get Direct Link
- Report Inappropriate Content
Response surface VS Mixture response surface
Hello Gentlemen,
I am writing because I am a little confused about the options that there are in JMP. I am trying to evaluate a DOE and the construction of the model Effect there are several option like response surface which is by default but I did a comparison with Minitab and I found different results between both softwares but I think the Minitab result is the good one because it is more according to the factor plots that I have previously so I started to play a little bit with the option and I found that mixture response surface was the closest one. Why is this happening? I tried to find more information about that in the JMP tutorial and there is lack of information
Note: my DOE is built by 4 factors and I’ve several response
Best regards


- Mark as New
- Bookmark
- Subscribe
- Mute
- Subscribe to RSS Feed
- Get Direct Link
- Report Inappropriate Content
Re: Response surface VS Mixture response surface
Even on the option of full factorial in custom design, i got duplicates values. Could you tell me why it is?

- Mark as New
- Bookmark
- Subscribe
- Mute
- Subscribe to RSS Feed
- Get Direct Link
- Report Inappropriate Content
Re: Response surface VS Mixture response surface
Archy,
Instead of sharing pictures, you should share the JMP data tables. That will have the necessary information to determine where things might be going wrong. From the captures that you have provided, I do not notice replicated runs (I did not go through every line in detail). However, if there are, it is because the custom design algorithm has determined that repeating certain trials is more informative for estimating the model than a new design point. Custom design chooses the design based on the MODEL YOU SPECIFY. Which, in one of your screen captures you only have a main effects model specified -- no interactions. For that model you would not need 45 trials, but since you asked for that many, JMP would likely repeat some of the runs.
You also stated that you get these repeats when "specifying the full factorial option in custom design." There is no "full-factorial option" in custom design.
- Mark as New
- Bookmark
- Subscribe
- Mute
- Subscribe to RSS Feed
- Get Direct Link
- Report Inappropriate Content
Re: Response surface VS Mixture response surface
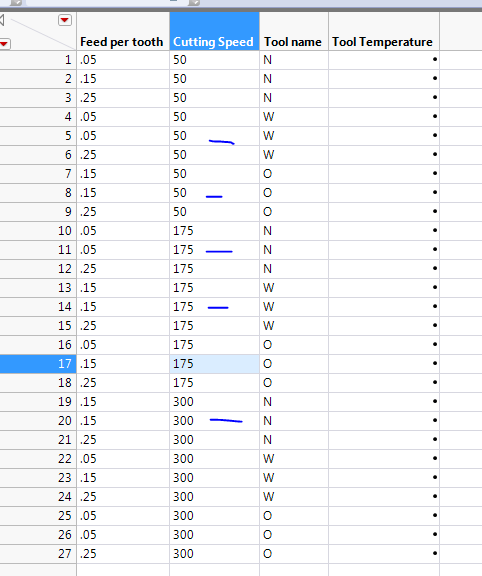
Okay, please find attach the two data tables, one i made in Excel which i must replicate and evaluate using a stadistical sofware like JMP and the custom data table which was made by JMP and is wrong. I put 0 in thereplicate box and i think so it is in picture of the parameters that i posted before. As i said in previous emails, my goal is to replicate and evaluate the excel DOE. What can i do? I did several test and nonestly, i could find something which can solve my issue in JMP. And yes you right. There is no option for full factorial in custome design but i did it because i inverted the order of my factorials in order to use the restriction DOE evaluation
Besr regards and have a nice week
- Mark as New
- Bookmark
- Subscribe
- Mute
- Subscribe to RSS Feed
- Get Direct Link
- Report Inappropriate Content
Re: Response surface VS Mixture response surface
Thank you for providing the files. This helps tremendously.
First, you state that you MUST replicate the Excel file. If that is the case, you are not really interested in creating a designed experiment. You are interested in running the specific trials in the Excel sheet. Why not just open the Excel table into JMP, run those trials, enter the responses and analyze?
You will ALWAYS have difficulty getting JMP to match your Excel table because JMP can do better than that table of runs.
A few issues that I saw from your table:
When specifying your factors, if the factor is continuous (like Feed per Tooth, Cutting Speed, and Width of Cut), then specify that factor as continuous rather than categorical. The only reason to specify them as discrete is to FORCE certain levels into the design. If you truly want to do that, specify a higher-order model and/or use the Discrete Numeric option.
When I made the factors continous (except for Tool Name), I created a 45 run design for the main-effects only model (attached design). I then compared the JMP generated custom design to the Excel table. The JMP custom design had equivalent or better power on all of the model terms. The JMP design had lower prediction variance than the Excel table for a large majority of the design space (and where it was worse, it was extremely close). I have attached the result as a picture. Bottom line is that JMP will not give you an inferior design if a better design exists.
Creating the design in this fashion with JMP does limit the factors to two levels. Experimentation is about EFFICIENCY. Do as few trials as possible to estimate your desired model. Then you use the model to determine the optimal settings. You do not need to try every combination in a grid to optimize a process. With this approach, because you were only specifying a main effects model, there is no need for more than two levels for any of the continuous factors. Conducting experiments at more than two level is wasteful.
Why insist on a third level? Many times it is because you expect a curved response. So, the model to use to estimate curvature is a response surface model. In JMP, I clicked the RSM button to get a response surface model (design attached as JMP RSM Design). That will force a 3rd level because it is needed to estimate a quadratic effect. I then compared this 45 run custom RSM design to the Excel table. Again, the JMP custom RSM design is superior as shown in the attached picture.
Remember that JMP is designed to create the best designed experiment possible, not to match a specific table of runs. The table of runs may not be the best choice. The only way to have JMP "create" a table to match the Excel table is to use DOE > Classical > Full Factorial. Specify all of the factors and create the design. Then you must manually remove the unwanted combination. Note that the last piece must be manual because if you do not do that combination you are NOT running a full factorial design. That is why JMP does not build that design automatically. That is the purpose of the custom design: create designs for your specific situation rather than trying to force fit a design that is not really appropriate.
You might wish to take a class on design of experiments or perhaps look at the Optimal Design of Experiments book by Goos and Jones to gain more insights on design creation. I hope this has been helpful.


- Mark as New
- Bookmark
- Subscribe
- Mute
- Subscribe to RSS Feed
- Get Direct Link
- Report Inappropriate Content
Re: Response surface VS Mixture response surface
Hello, thanks you for your tables and your feedback. I reviewed the tables and images that you uploaded and I have some technical difficulties to develop the experiments of RMS table. Simply because the tool which is noted by O cannot exceed more than 1. It is a restriction that we have. We developed a screening before and we stablished the operational parameters. Indeed, we developed all the experiments and we are looking to analysis the data and have some Pareto chart of standardized effect and make the ANOVA and see which parameters have most significant effect. I haven’t try JMP excel tool yet because I thought Fit model was powerful enough to make it. However, I still have some question.
What did you mean with that “ The only reason to specify them as discrete is to FORCE certain levels into the design. If you truly want to do that, specify a higher-order model and/or use the Discrete Numeric option”
How did you get the factor RS in the fit model option?
Finally, retaking the las point,
“Remember that JMP is designed to create the best designed experiment possible, not to match a specific table of runs. The table of runs may not be the best choice. The only way to have JMP "create" a table to match the Excel table is to use DOE > Classical > Full Factorial. Specify all of the factors and create the design. Then you must manually remove the unwanted combination. Note that the last piece must be manual because if you do not do that combination you are NOT running a full factorial design. That is why JMP does not build that design automatically. That is the purpose of the custom design: create designs for your specific situation rather than trying to force fit a design that is not really appropriate.”
Actually, I did that at the beginning of this discussion and I found the results are not correct if I compared the results for example with Minitab; however, I remembered that you told me that I just match the DOE with the model.
Best regards and have a nice day

- Mark as New
- Bookmark
- Subscribe
- Mute
- Subscribe to RSS Feed
- Get Direct Link
- Report Inappropriate Content
Re: Response surface VS Mixture response surface
If I may, I would like to add to what @Dan_Obermiller has written.
The method you used to first analyze your data in JMP was not a fair comparison to minitab because you only had categorical factors. You cannot estimate quadratic or squared terms with categorical factors so there is no response surface. That is why Dan was saying to change the factors to continuous. With continous factors you can get the desired quadratic estimates if they indeed exist and important to the model. It would be good to see your minitab model output to see if there are any squared terms in your model. If there are that would help explain the difference in the models you saw initially.
The last image you shared looked like you were getting close to what Dan was.
HTH
Bill
- Mark as New
- Bookmark
- Subscribe
- Mute
- Subscribe to RSS Feed
- Get Direct Link
- Report Inappropriate Content
Re: Response surface VS Mixture response surface
Hello Bill,
Yes, I modified my factors from categorical to continuous and see the results but I couldn’t find any differences in the surface response, see attached picture. To your question, Minitab is working in full quadratic as default option, see attached picture too.
Best regards
- Mark as New
- Bookmark
- Subscribe
- Mute
- Subscribe to RSS Feed
- Get Direct Link
- Report Inappropriate Content
Re: Response surface VS Mixture response surface
Thank you for the images and it looks as if you are more than likely in an overfit situation with your minitab model. The JMP effect summary is showing the factors that are most important and active in the model based on p-value and logworth value. Based on the JMP output the quadratic effects appear to be of little influence on the best overall model. I am not familiar with how minitab helps find the most important factors for their models, but that might be a good place to start to make sure you model is not overfit.
- Mark as New
- Bookmark
- Subscribe
- Mute
- Subscribe to RSS Feed
- Get Direct Link
- Report Inappropriate Content
Re: Response surface VS Mixture response surface
Hello Bill,
You have a good point there. How could i know when a system is over fiting and when it is not? Me neither i don't know how minitab does it. I said in previous email. I just selected the default parameters which are describe in the toturial. I agree with you in some times but the problem that i cannot fix that i have someparameters which are not evaluated by JMP like the width of cut or appears to be no significant. On the other hand, minitab puts this factor as significant. it is 180 degrees of difference.
Best regards
- Mark as New
- Bookmark
- Subscribe
- Mute
- Subscribe to RSS Feed
- Get Direct Link
- Report Inappropriate Content
Re: Response surface VS Mixture response surface
Hello Archy,
With JMP there are many ways to set up cross-validation to help avoid overfitting your model. Almost every platform within JMP allows K-fold cross-validation. If you have a smaller data set use a k-fold for the number of samples (rows) in your data set. For example if you have 20 rows set your k-fold to 20. This is also called leave-one-out cross-validation.
If you are using JMP Pro you can use a validation column and one other option would be to let JMP randomly select up to 20% of your data and then hide and exclude the selected data to be used as a holdout set to test the predictive capability of your model.
Overfitting is a real issue for many predictive models. Check your p-values for each parameter. With JMP the default p-value for variables that are important for the model is 0.05. Anything above that value is suspect and you should check the model predictive capability with and without variables that have a p-value above 0.05.
One other telltale sign that you might be overfit is if your R-square and R-square adjusted values are significantly different from each other. Those two values will likely be fairly close together if the model is not overfit. There are several other ways to check for overfitting, but the above should help you decide whether JMP or minitab is giving you the better predictive model.
Hope this helps.
Best,
Bill
Recommended Articles
- © 2026 JMP Statistical Discovery LLC. All Rights Reserved.
- Terms of Use
- Privacy Statement
- Contact Us