This website uses Cookies. Click Accept to agree to our website's cookie use as described in our Privacy Policy. Click Preferences to customize your cookie settings.
- JMP User Community
- :
- Discussions
- :
- Re: Replicating DOE analysis from a paper
Turn on suggestions
Auto-suggest helps you quickly narrow down your search results by suggesting possible matches as you type.
Topic Options
- Subscribe to RSS Feed
- Mark Topic as New
- Mark Topic as Read
- Float this Topic for Current User
- Bookmark
- Subscribe
- Printer Friendly Page

Level II
- Mark as New
- Bookmark
- Subscribe
- Mute
- Subscribe to RSS Feed
- Get Direct Link
- Report Inappropriate Content
Replicating DOE analysis from a paper
Created:
Feb 26, 2023 08:28 AM
| Last Modified: Jun 8, 2023 12:33 PM
(1944 views)
Hey guys,
very very new to the JMP/DOE/stat world and I have some questions.
I'd like to replicate ANOVA and RSM analysis I've found in a journal.
What I know:
CCD design
20 treatments including 5 center points
3 factors and 3 responses
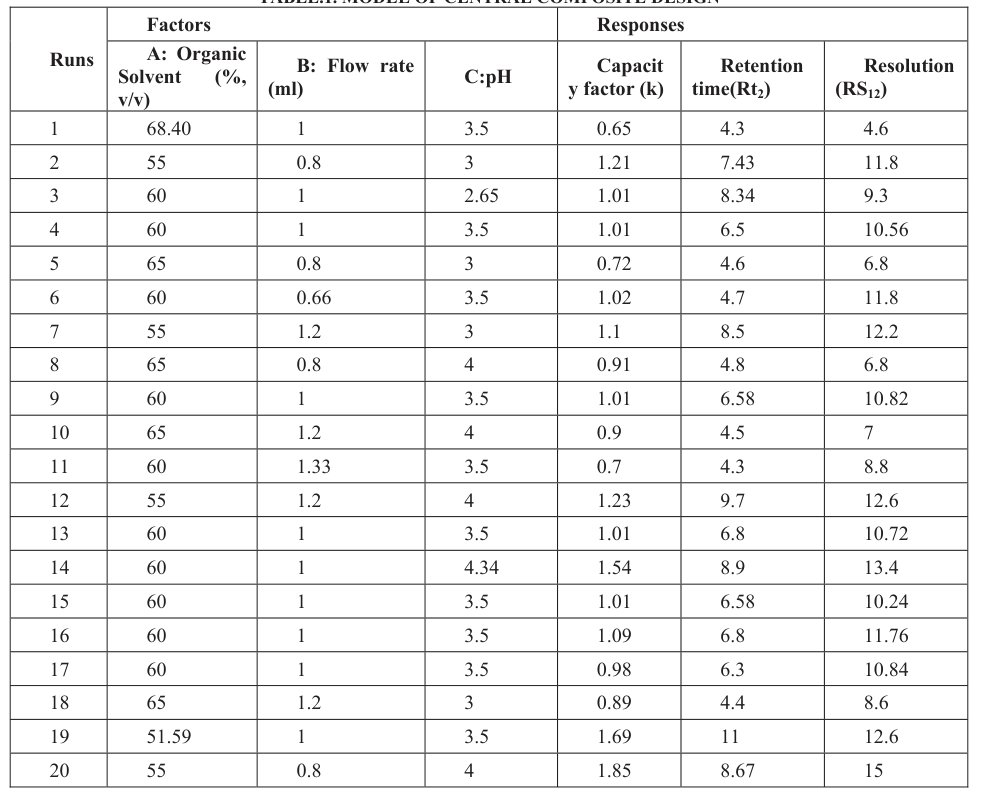
Table of factors and their responses is attached.
What I learned from the table:
- rotatable CCD (value of 1.682)
- it's actually 6 center points, not 5 (am I correct with this one? Value combination of 60/1/3.5 appears 6 times)
I am not sure how to incorporate axial values to the analysis. Do I just go Fit Model and then add factors via Macros/Response Surface?
Thanks!
16 REPLIES 16

Super User
- Mark as New
- Bookmark
- Subscribe
- Mute
- Subscribe to RSS Feed
- Get Direct Link
- Report Inappropriate Content
Re: Replicating DOE analysis from a paper
Created:
Mar 3, 2023 11:43 AM
| Last Modified: Mar 3, 2023 12:18 PM
(688 views)
| Posted in reply to message from Victor_G 03-03-2023
Victor, I have the following thoughts/comments/questions (Note: I did not thoroughly read the paper):
1. The first issue I have with the analysis is I don't know what practical significance is for the 3 response variables? How much of a change in Capacity, Retention or Resolution is of scientific or engineering interest? The range for each is 1.2, 6.7 and 10.4 (in order). Is this interesting? Need an SME to help.
2. I don't see run order in the data table?
3. It appears the terms removed from the model and replication of the 6 center points is what is being used for the estimate of the MSE for statistical tests (again, without run order are these replicates or repeats?). This variation (the removed terms, which can bias the MSE) is very small in comparison to the total variation, hence why so many terms in the model look statistically significant (especially Capacity and Retention). There is a mention of within day and between day estimates of precision. I do not see day accounted for? So the question is, is the variation of the removed terms and the replicated counterpoints representative of the true variance (random errors) in the process? If I look at a Normal plot and use Lenth's PSE, it appears the RMSE may be under-estimated (note: JMP labels estimates according to RMSE, not PSE)


4. There're 2 outliers from a multivariate analysis (-,-,+ where all responses are particularly high, and a,0,0 where Retention is high) what happened there?

5. Is there any estimate of measurement error or was the measurement system studied in the paper?
6. I didn't take a detailed look at residuals yet, but residuals or Resolution look unusual.

7. The correlation of the prediction formulas from your analysis and the paper analysis are excellent (.9999, 1.0, .9954).

"All models are wrong, some are useful" G.E.P. Box
Level II
- Mark as New
- Bookmark
- Subscribe
- Mute
- Subscribe to RSS Feed
- Get Direct Link
- Report Inappropriate Content
Re: Replicating DOE analysis from a paper
statman, thank you for giving this analysis a go too. I might be able to help with question 1 however can you clarify a bit what is it you want to know about the three responses? I don't know how to explain "interesting" but I am aware of the function and "good" values for those.
Super User
- Mark as New
- Bookmark
- Subscribe
- Mute
- Subscribe to RSS Feed
- Get Direct Link
- Report Inappropriate Content
Re: Replicating DOE analysis from a paper
Sure, before any data analysis, it must be determined whether the variation in the response(s) is sufficient enough to be worthwhile to do any statistical analysis. I have no context for the responses in the data table, so I don't know if they varied sufficiently. The question I always ask is what is the smallest increment of change in the response that would be of interest or would you care about? This I call Practical Significance.
"All models are wrong, some are useful" G.E.P. Box
Level II
- Mark as New
- Bookmark
- Subscribe
- Mute
- Subscribe to RSS Feed
- Get Direct Link
- Report Inappropriate Content
Re: Replicating DOE analysis from a paper
Created:
Mar 7, 2023 03:56 AM
| Last Modified: Mar 7, 2023 03:57 AM
(651 views)
| Posted in reply to message from statman 03-06-2023
statman, let me try this.
capacity factor: here we want (almost a necessity) a value of at least 1. It doesn't matter if it's 2.5 or 3 but it matters a lot if it's 0.5 and 1.0
retention time: the idea behind the range here is just faster is better (with others responses being optimal). A runtime of 4 would be preferable to runtime of 11.
Resolution: here we want (almost a necessity) a value of at least 2. It's basically a measure of spaking between the locations of the two molecules. Values such as 15 are excessive.
In my opinion, response values vary quite a lot, and they are above the threshold of minimum increment of change in the response. If ranges were 10x less (0.12, 0.67, 1.04) then my answer would be no (generally).
Level II
- Mark as New
- Bookmark
- Subscribe
- Mute
- Subscribe to RSS Feed
- Get Direct Link
- Report Inappropriate Content
Re: Replicating DOE analysis from a paper
Another thing I've noticed here - could it be an issue that data for capacity factor response doesn't seem to be normally distributed?


Super User
- Mark as New
- Bookmark
- Subscribe
- Mute
- Subscribe to RSS Feed
- Get Direct Link
- Report Inappropriate Content
Re: Replicating DOE analysis from a paper
Not IMHO. Remember, you are manipulating factors and that is the response variable. Essentially you are trying to create variation in that response, hopefully assignable, therefore not randomly distributed. What you want normally distributed is the residuals (NID(0, variance)).
"All models are wrong, some are useful" G.E.P. Box

Staff
- Mark as New
- Bookmark
- Subscribe
- Mute
- Subscribe to RSS Feed
- Get Direct Link
- Report Inappropriate Content
Re: Replicating DOE analysis from a paper
Hi,
In addition to what @Victor_G has shown you about designing the experiment, I think you are interested in how to repeat the analysis in JMP.
The starting point is obviously to have the data in JMP. If this comes from a pdf, you should be able to import the data using the option in JMP to import from pdf.
Or you can manually input the data into a JMP table.
Or you might have the data as .csv or .xlsx, which can also be imported directly into JMP.
I suggest that you share the data as a JMP file first. Then the community will be able to help you to replicate the analysis.
I hope this helps,
Phil
- « Previous
-
- 1
- 2
- Next »
- © 2024 JMP Statistical Discovery LLC. All Rights Reserved.
- Terms of Use
- Privacy Statement
- About JMP
- JMP Software
- JMP User Community
- Contact