- New to JMP? Join us Sept. 23-24 for the Early User Edition of Discovery Summit, tailor-made for new users. Register now for free!
- Use World Cup data to build models, explore spatial relationships, and create informative visualizations in JMP. Register. July 17, 2 pm US Eastern Time.
- Your voice matters! Tell us how you prefer to receive JMP updates, so we can tailor our communication to your needs. Take short survey.
- Subscribe to RSS Feed
- Mark Topic as New
- Mark Topic as Read
- Float this Topic for Current User
- Bookmark
- Subscribe
- Mute
- Printer Friendly Page
Discussions
Solve problems, and share tips and tricks with other JMP users.- JMP User Community
- :
- Discussions
- :
- Replicating DOE analysis from a paper

- Mark as New
- Bookmark
- Subscribe
- Mute
- Subscribe to RSS Feed
- Get Direct Link
- Report Inappropriate Content
Replicating DOE analysis from a paper
Hey guys,
very very new to the JMP/DOE/stat world and I have some questions.
I'd like to replicate ANOVA and RSM analysis I've found in a journal.
What I know:
CCD design
20 treatments including 5 center points
3 factors and 3 responses
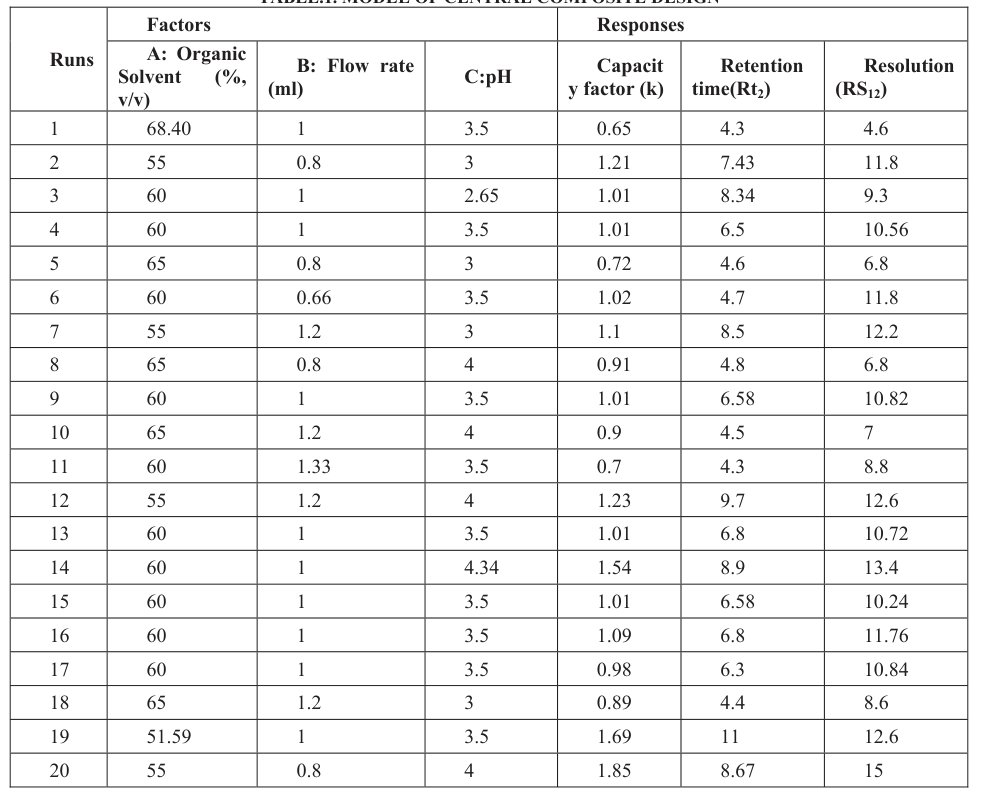
Table of factors and their responses is attached.
What I learned from the table:
- rotatable CCD (value of 1.682)
- it's actually 6 center points, not 5 (am I correct with this one? Value combination of 60/1/3.5 appears 6 times)
I am not sure how to incorporate axial values to the analysis. Do I just go Fit Model and then add factors via Macros/Response Surface?
Thanks!
Accepted Solutions

- Mark as New
- Bookmark
- Subscribe
- Mute
- Subscribe to RSS Feed
- Get Direct Link
- Report Inappropriate Content
Re: Replicating DOE analysis from a paper
Hi @PolygonBison420,
Welcome in the Community !
In order to create a similar design, you can go in "DoE" menu, then "Classical" and "Response Surface Design".
You can then specify the 3 continuous factor and 3 responses.
Then you have the choice between different designs :

The CCD with Uniform Precision does contain 6 centre points, like in your example.
Then, select the axial value corresponding to rotatable design (1,682 for 3 continuous factors) :

And you'll end up with a similar design to the one you have shown. Here is the script to generate the design :
DOE(
	Response Surface Design,
	{Add Response( Maximize, "Capacity factor (k)", ., ., . ),
	Add Response( Minimize, "Retention time (Rt2)", ., ., . ),
	Add Response( Maximize, "Resolution (RS12)", ., ., . ),
	Change Factor Settings( 1, 55, 65, "A: Organic Solvent" ),
	Change Factor Settings( 2, 0.8, 1.2, "B: Flow rate" ),
	Add Factor( Continuous, 3, 4, "C: pH", 0 ), Set Random Seed( 31406552 ),
	Make Design( 2 ), Set Axial Choice( 1 ), Center Points( 6 ),
	Simulate Responses( 0 ), Save X Matrix( 0 ), Set Run Order( Randomize ),
	Make Table}
)
For more infos about Response Surface Designs, you can look here : Build a Response Surface Design (jmp.com)
In order to analyze each model linked to the responses, you can have a look here : Standard Least Squares Models (jmp.com)
I attach the design datatable with a script "Fit Least Squares" that provides the analysis of the responses (please take note that I am not sure that the target for each response is correct, i.e Capacity factor should be maximized, Retention time should be minimized, and Resolution should be maximized ?).
You can try it yourself by launching the script "Model", selecting the responses (model is already defined, but if you have to do it manually you can select the factors and use the macro "Response Surface") and check "Fit Separately". You can then compare the models in the publication with yours.
Hope this answer will help you,
"It is not unusual for a well-designed experiment to analyze itself" (Box, Hunter and Hunter)
- Mark as New
- Bookmark
- Subscribe
- Mute
- Subscribe to RSS Feed
- Get Direct Link
- Report Inappropriate Content
Re: Replicating DOE analysis from a paper
Hi @PolygonBison420,
Welcome in the Community !
In order to create a similar design, you can go in "DoE" menu, then "Classical" and "Response Surface Design".
You can then specify the 3 continuous factor and 3 responses.
Then you have the choice between different designs :
The CCD with Uniform Precision does contain 6 centre points, like in your example.
Then, select the axial value corresponding to rotatable design (1,682 for 3 continuous factors) :
And you'll end up with a similar design to the one you have shown. Here is the script to generate the design :
DOE(
	Response Surface Design,
	{Add Response( Maximize, "Capacity factor (k)", ., ., . ),
	Add Response( Minimize, "Retention time (Rt2)", ., ., . ),
	Add Response( Maximize, "Resolution (RS12)", ., ., . ),
	Change Factor Settings( 1, 55, 65, "A: Organic Solvent" ),
	Change Factor Settings( 2, 0.8, 1.2, "B: Flow rate" ),
	Add Factor( Continuous, 3, 4, "C: pH", 0 ), Set Random Seed( 31406552 ),
	Make Design( 2 ), Set Axial Choice( 1 ), Center Points( 6 ),
	Simulate Responses( 0 ), Save X Matrix( 0 ), Set Run Order( Randomize ),
	Make Table}
)
For more infos about Response Surface Designs, you can look here : Build a Response Surface Design (jmp.com)
In order to analyze each model linked to the responses, you can have a look here : Standard Least Squares Models (jmp.com)
I attach the design datatable with a script "Fit Least Squares" that provides the analysis of the responses (please take note that I am not sure that the target for each response is correct, i.e Capacity factor should be maximized, Retention time should be minimized, and Resolution should be maximized ?).
You can try it yourself by launching the script "Model", selecting the responses (model is already defined, but if you have to do it manually you can select the factors and use the macro "Response Surface") and check "Fit Separately". You can then compare the models in the publication with yours.
Hope this answer will help you,
"It is not unusual for a well-designed experiment to analyze itself" (Box, Hunter and Hunter)
- Mark as New
- Bookmark
- Subscribe
- Mute
- Subscribe to RSS Feed
- Get Direct Link
- Report Inappropriate Content
Re: Replicating DOE analysis from a paper
Victor, that works brilliantly. I was just confused since authors talked about 5 center points which didn't make sense when looking at the options suggested by JMP. Center points are always treatment of all variables at the middle level/0, right?
It seems it's also harder to recreate RSMs from the papers since almost no authors list response limits.
Since you've been so kind to recreate the design in JMP I also want to ask you what's the most effective way to do so.
For instance, I recreate the design via DOE/Clasical/RSD. My result is a data table with the variables however what's the best way to add response data from the paper?
Is there a quick way for me to match the pattern order of the runs of the paper (via random seed perhaps)? Or do I just have to manually seek for it ("aha --- treatment is in line four, let's copy the response to the first response column of my table..." ).
Hope the question makes sense.
Phil, thanks for the suggesting that.
- Mark as New
- Bookmark
- Subscribe
- Mute
- Subscribe to RSS Feed
- Get Direct Link
- Report Inappropriate Content
Re: Replicating DOE analysis from a paper
Hi @PolygonBison420,
Is the paper accessible online ? Do you have a link (it could help to better know how the centre points were defined, what were their expected goals regarding the different responses, and their conclusions/interpretation/optimum found).
Centre points are points that have all factors at their middle level 0, right.
Maybe the authors meant that they had replicated centre point 5 times (or did 5 replicate runs of the centre point) ?
In my case, I generated a design through JMP, and had to "manually" match the responses values from your screenshot to the correct rows of the design. Not an optimal solution, I know, there might be a possibility to have the same order of rows, but as you mention, that would mean knowing the random seed (from the publication) and having access and use it in JMP during design creation : Output Options (jmp.com) (option in the red triangle of the DoE window creation "Set Random Seed").
As @Phil_Kay suggested, you might also directly import the table from the pdf or .csv/.xslx into JMP (this way you don't have to manually copy-paste some values), but before running the analysis, you may have to add some column properties, so that JMP better understand some properties linked to your factors and responses :
- For factors, column properties "Coding" (specifying values for low (-1) and high (+1) levels), "Design Role" (specifying the type of factor in your design, here "Continuous" for the 3 factors) and "Factor Changes" (by default on "Easy", but for specific design like split-plot design, it is changed to hard or very hard in order to constrain the randomization of runs),
- For Responses, column property "Response Limits" is necessary so that the optimization goal is set (maximize, minimize, match target or None), and the values and associated desirabilities are known for the Prediction Profiler.
I hope this answer will help you,
"It is not unusual for a well-designed experiment to analyze itself" (Box, Hunter and Hunter)
- Mark as New
- Bookmark
- Subscribe
- Mute
- Subscribe to RSS Feed
- Get Direct Link
- Report Inappropriate Content
Re: Replicating DOE analysis from a paper
Victor,
thanks again.
The paper (open access):
https://aip.scitation.org/doi/pdf/10.1063/1.5112268
I did look more carefully in the center points but all I can find is the following quotes:
"Twenty experiments along with 5 center points were studies with three factors"
"A three-factorial, CCD was taken with fifteen experimental runs and 5 center points"
Your process of matching responses was similar to mine then.
- Mark as New
- Bookmark
- Subscribe
- Mute
- Subscribe to RSS Feed
- Get Direct Link
- Report Inappropriate Content
Re: Replicating DOE analysis from a paper
Thanks a lot for the link.
I'm checking the analysis results from the script "Fit Least Squares" I added in the datatable, you'll have very similar results (if not identical) to what is described and analyzed in the publication.
Concerning the optimization goals (maximize/minimize), it seems my initial guess was right, as when I am trying to optimize all responses with the Prediction Profiler from the "Fit Group", I have an optimum at 56,09 for factor A, 0,8 for factor B (flow rate) and 4 for factor C (pH) :

Compared to 56,1 for A, 0,8 for B and 3,7 for C in the publication :

However, I am surprised by the results of the predictions of the validation point from the publication, as Retention Time and Resolution have different prediction results when predicting in JMP, compared to the values in the publication, despite having similar models and similar prediction equations.
Here are my predicted values for the optimum found in the publication and with the same terms in the responses models :

I don't understand how predicted values can be so different (and not in the confidence intervals) between the publication and JMP (more noticeable for Resolution and Retention Time) ? I also tried relaunching a model with 3-factors interaction and cubic power terms (even if in the publication they mentioned only quadratic model), but that didn't create predicted values closer to what is obtained in terms of measured values and predicted values in the paper.
As the content related to analysis is quite light, I don't know exactly how they are obtaining these predicted values for the optimum.
If anyone has an idea, feel free to solve this mystery :)
"It is not unusual for a well-designed experiment to analyze itself" (Box, Hunter and Hunter)
- Mark as New
- Bookmark
- Subscribe
- Mute
- Subscribe to RSS Feed
- Get Direct Link
- Report Inappropriate Content
Re: Replicating DOE analysis from a paper
Hey Victor,
thank you for still trying with this one.
I also got the pH value of 4 (compared to 3.8) and I still don't know why those values differ. To be fair, I kind of gave up after that so I didn't even notice the mismatch with the validation and such.
- Mark as New
- Bookmark
- Subscribe
- Mute
- Subscribe to RSS Feed
- Get Direct Link
- Report Inappropriate Content
Re: Replicating DOE analysis from a paper
Hi @PolygonBison420,
Since we don't know exactly the desirability targets/profiles for each response (and relative importance/weight of each response), I'm not surprised to not have found exactly the optimum found in the publication (even if the one found with JMP is very close from the one in the publication, which is a good sign).
What troubles me the most are really these predicted values for responses for the validation point. As we are able to have very similar (if not exactly the same) models for each response, predicted values for the factors levels set on the optimum from the publication should give us very close values. Since it's not the case, I'm really wondering if/what I may have missed, or if/what the authors have missed.
"It is not unusual for a well-designed experiment to analyze itself" (Box, Hunter and Hunter)

- Mark as New
- Bookmark
- Subscribe
- Mute
- Subscribe to RSS Feed
- Get Direct Link
- Report Inappropriate Content
Re: Replicating DOE analysis from a paper
Just a comment...I have found errors in many analyses of published papers in well respected journals. I don't think there is much rigor challenging analysis to get a paper published. Without knowing how the analysis was performed, subtle differences are not unusual and in this case might be rounding protocol.
- Mark as New
- Bookmark
- Subscribe
- Mute
- Subscribe to RSS Feed
- Get Direct Link
- Report Inappropriate Content
Re: Replicating DOE analysis from a paper
Hi @statman,
Interesting, thanks for sharing your comment. I wouldn't have been so "perplexed" if the predicted values between JMP models and the publication were close, but here, for at least 2 out of 3 responses, the differences are quite big.
I just retried this morning to change the formula from the models and "round up" the parameters from the equation based on the equation models from the publication (just to be sure I didn't miss something), but I'm not getting the same results as they have in the publication...
Sure, they have nice predicted values for their responses (almost too good to be true...), but I really don't know how they could get these based on the modeling and equations they have.
The datatable is attached if you want to take a look (I added three formula columns for the equations from the publication, and the validation point to compare actual vs. predicted values from the models).
"It is not unusual for a well-designed experiment to analyze itself" (Box, Hunter and Hunter)
Recommended Articles
- © 2026 JMP Statistical Discovery LLC. All Rights Reserved.
- Terms of Use
- Privacy Statement
- Contact Us