JMP Security Notice: CVE-2026-109618 and CVE-2026-109619
JMP promptly initiated a review of its products, services, and relevant infrastructure for exposure to CVE-2026-109618 and CVE-2026-109619.
Our assessment of JMP products has not identified exposure to these vulnerabilities. Where remediation was required within supporting environments, appropriate security updates and controls have been applied and validated.
We have identified no evidence of successful exploitation or unauthorized access to JMP systems or customer information associated with these vulnerabilities.
JMP continues to monitor the issue and relevant vendor guidance. No action is required by JMP customers at this time.
- Don’t miss your chance to experience Discovery Summit Europe at our best available rate! Early bird registration through 31 Oct.
- Graph Builder Toolbar streamlines interactive graphing. Creates shortcuts on Report and GraphBuilder Helpers toolbars. Download and install the extension.
- Subscribe to RSS Feed
- Mark Topic as New
- Mark Topic as Read
- Float this Topic for Current User
- Bookmark
- Subscribe
- Mute
- Printer Friendly Page
Discussions
Solve problems, and share tips and tricks with other JMP users.- User Community
- :
- Discussions
- :
- Re: ROC curve settings

- Mark as New
- Bookmark
- Subscribe
- Mute
- Subscribe to RSS Feed
- Get Direct Link
- Report Inappropriate Content
ROC curve settings
Hi there,
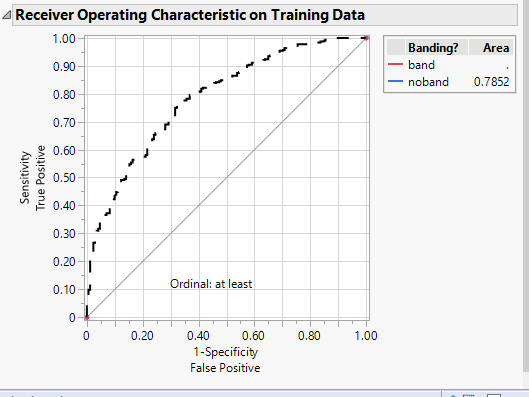
I have created ROC curves and combined several together in one graph. I have understood how to change the colours of the according curves. However I need the graphs to be black and white, hence the lines need to be dotted or dashed which I am unfortunately unable to change. Any tips? much appreciated thanks.


- Mark as New
- Bookmark
- Subscribe
- Mute
- Subscribe to RSS Feed
- Get Direct Link
- Report Inappropriate Content
Re: ROC curve settings
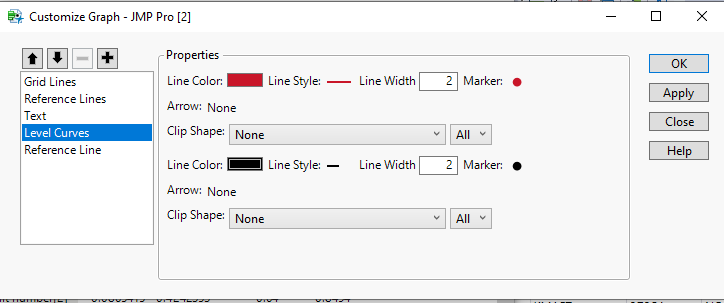
If you right click on the graph, and select Customize, you can change the line color and style
- Mark as New
- Bookmark
- Subscribe
- Mute
- Subscribe to RSS Feed
- Get Direct Link
- Report Inappropriate Content
Re: ROC curve settings
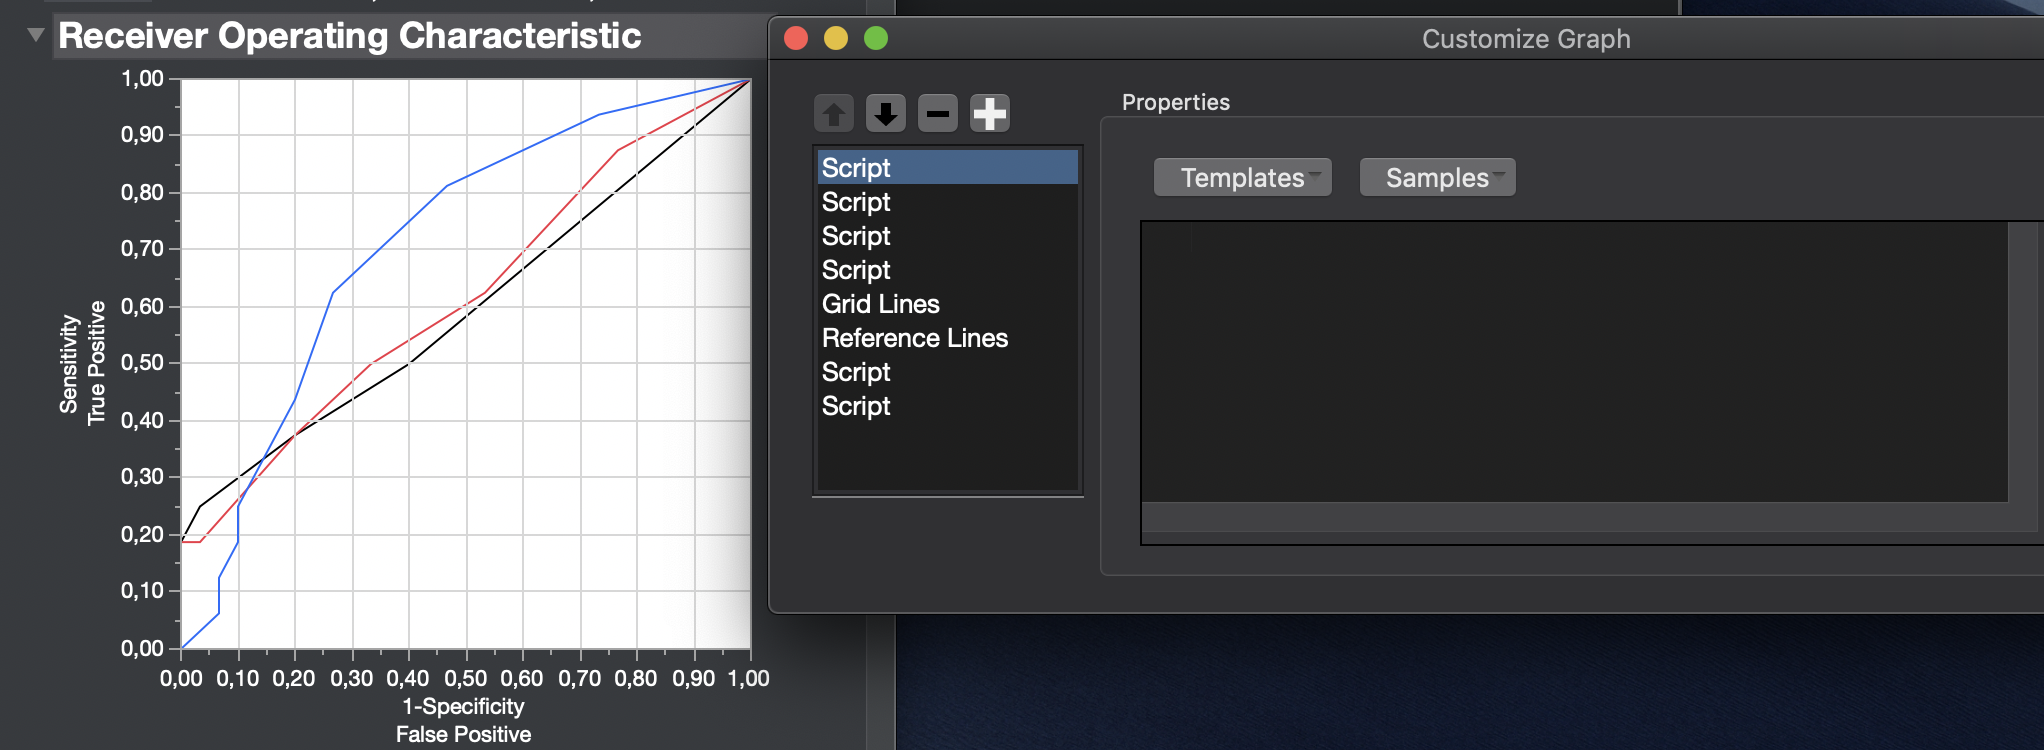
thanks very much for the quick answer. however, when I right click and choose customise I get the script version (see below) and I am not very good at "programming".
any tips?
- Mark as New
- Bookmark
- Subscribe
- Mute
- Subscribe to RSS Feed
- Get Direct Link
- Report Inappropriate Content
Re: ROC curve settings
It appears from your attached image that you are on an Apple system. I am on a Window's system, which surfaces additional objects in for Customize
I look to others in the Community who might have an insight to a solution for you.

- Mark as New
- Bookmark
- Subscribe
- Mute
- Subscribe to RSS Feed
- Get Direct Link
- Report Inappropriate Content
Re: ROC curve settings
Any solution so far, when you encounter the issue of the script during ROC graph customization?
Recommended Articles
- © 2026 JMP Statistical Discovery LLC. All Rights Reserved.
- Terms of Use
- Privacy Statement
- Contact Us