- JMP Statement Regarding Critical PHP Remote Code Execution Vulnerabilities (CVE-2026-109618, CVE-2026-109619)
- Don’t miss your chance to experience Discovery Summit Europe at our best available rate! Early bird registration through 31 Oct.
- Graph Builder Toolbar streamlines interactive graphing. Creates shortcuts on Report and GraphBuilder Helpers toolbars. Download and install the extension.
- Subscribe to RSS Feed
- Mark Topic as New
- Mark Topic as Read
- Float this Topic for Current User
- Bookmark
- Subscribe
- Mute
- Printer Friendly Page
Discussions
Solve problems, and share tips and tricks with other JMP users.- User Community
- :
- Discussions
- :
- Re: ROC curve settings

- Mark as New
- Bookmark
- Subscribe
- Mute
- Subscribe to RSS Feed
- Get Direct Link
- Report Inappropriate Content
ROC curve settings
Hi there,
I have created ROC curves and combined several together in one graph. I have understood how to change the colours of the according curves. However I need the graphs to be black and white, hence the lines need to be dotted or dashed which I am unfortunately unable to change. Any tips? much appreciated thanks.


- Mark as New
- Bookmark
- Subscribe
- Mute
- Subscribe to RSS Feed
- Get Direct Link
- Report Inappropriate Content
Re: ROC curve settings
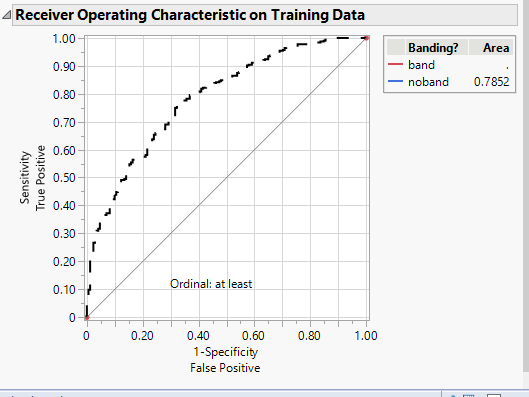
If you right click on the graph, and select Customize, you can change the line color and style
- Mark as New
- Bookmark
- Subscribe
- Mute
- Subscribe to RSS Feed
- Get Direct Link
- Report Inappropriate Content
Re: ROC curve settings
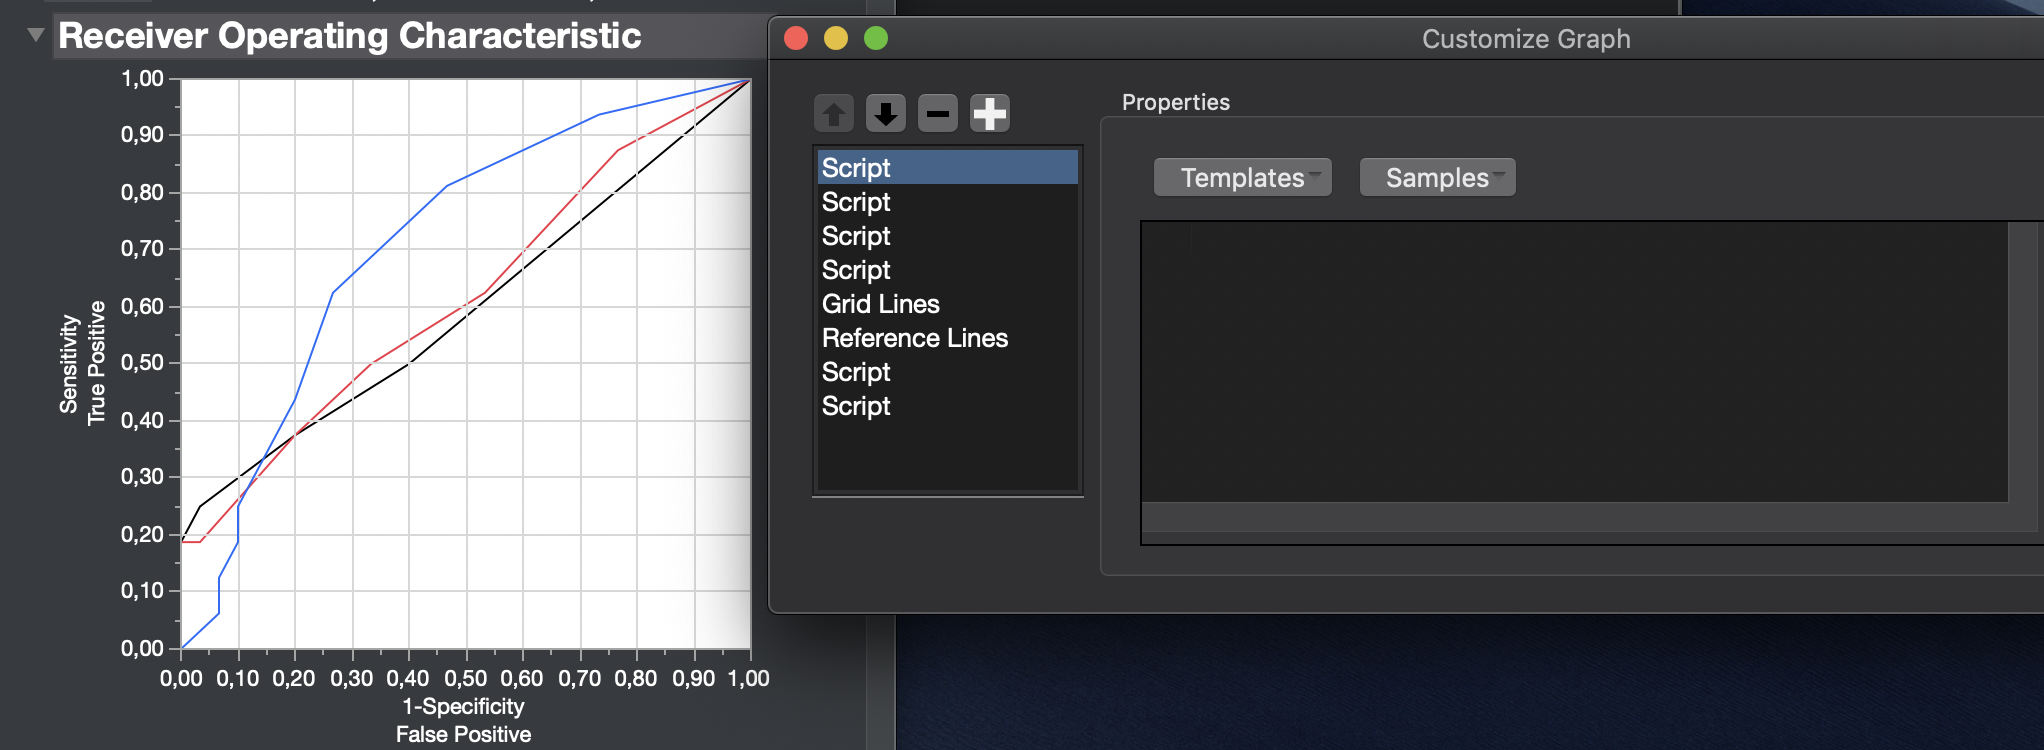
thanks very much for the quick answer. however, when I right click and choose customise I get the script version (see below) and I am not very good at "programming".
any tips?
- Mark as New
- Bookmark
- Subscribe
- Mute
- Subscribe to RSS Feed
- Get Direct Link
- Report Inappropriate Content
Re: ROC curve settings
It appears from your attached image that you are on an Apple system. I am on a Window's system, which surfaces additional objects in for Customize
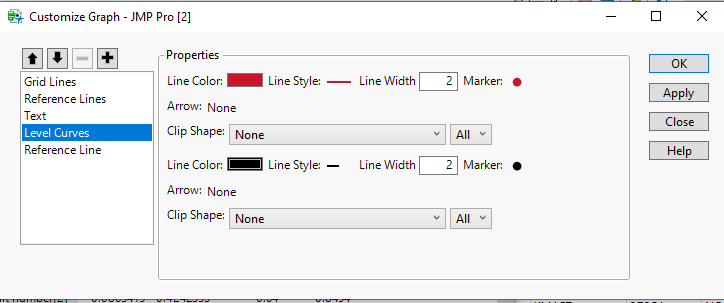
I look to others in the Community who might have an insight to a solution for you.

- Mark as New
- Bookmark
- Subscribe
- Mute
- Subscribe to RSS Feed
- Get Direct Link
- Report Inappropriate Content
Re: ROC curve settings
Any solution so far, when you encounter the issue of the script during ROC graph customization?
Recommended Articles
- © 2026 JMP Statistical Discovery LLC. All Rights Reserved.
- Terms of Use
- Privacy Statement
- Contact Us