Turn on suggestions
Auto-suggest helps you quickly narrow down your search results by suggesting possible matches as you type.
- New to JMP? Join us Sept. 23-24 for the Early User Edition of Discovery Summit, tailor-made for new users. Register now for free!
- Your voice matters! Tell us how you prefer to receive JMP updates, so we can tailor our communication to your needs. Take short survey.
- See how to access JMP Marketplace - and - find, create & share add-ins to extend your JMP. Watch video.
Options
- Subscribe to RSS Feed
- Mark Topic as New
- Mark Topic as Read
- Float this Topic for Current User
- Bookmark
- Subscribe
- Mute
- Printer Friendly Page
Discussions
Solve problems, and share tips and tricks with other JMP users.- JMP User Community
- :
- Discussions
- :
- Probability density function_pdf

Level III
- Mark as New
- Bookmark
- Subscribe
- Mute
- Subscribe to RSS Feed
- Get Direct Link
- Report Inappropriate Content
Probability density function_pdf
Created:
Aug 13, 2021 01:14 PM
| Last Modified: Jun 11, 2023 4:16 AM
(4832 views)
Good afternoon all,
I am looking to make a probability density function graph, how best can I do it using jump graph builder? How can the density (y) axis be scaled?
some like what I have attached in the image.
Thank you.

Gabriel Mulero
1 ACCEPTED SOLUTION
Accepted Solutions

Level III
Solution
- Mark as New
- Bookmark
- Subscribe
- Mute
- Subscribe to RSS Feed
- Get Direct Link
- Report Inappropriate Content
Re: Probability density function_pdf
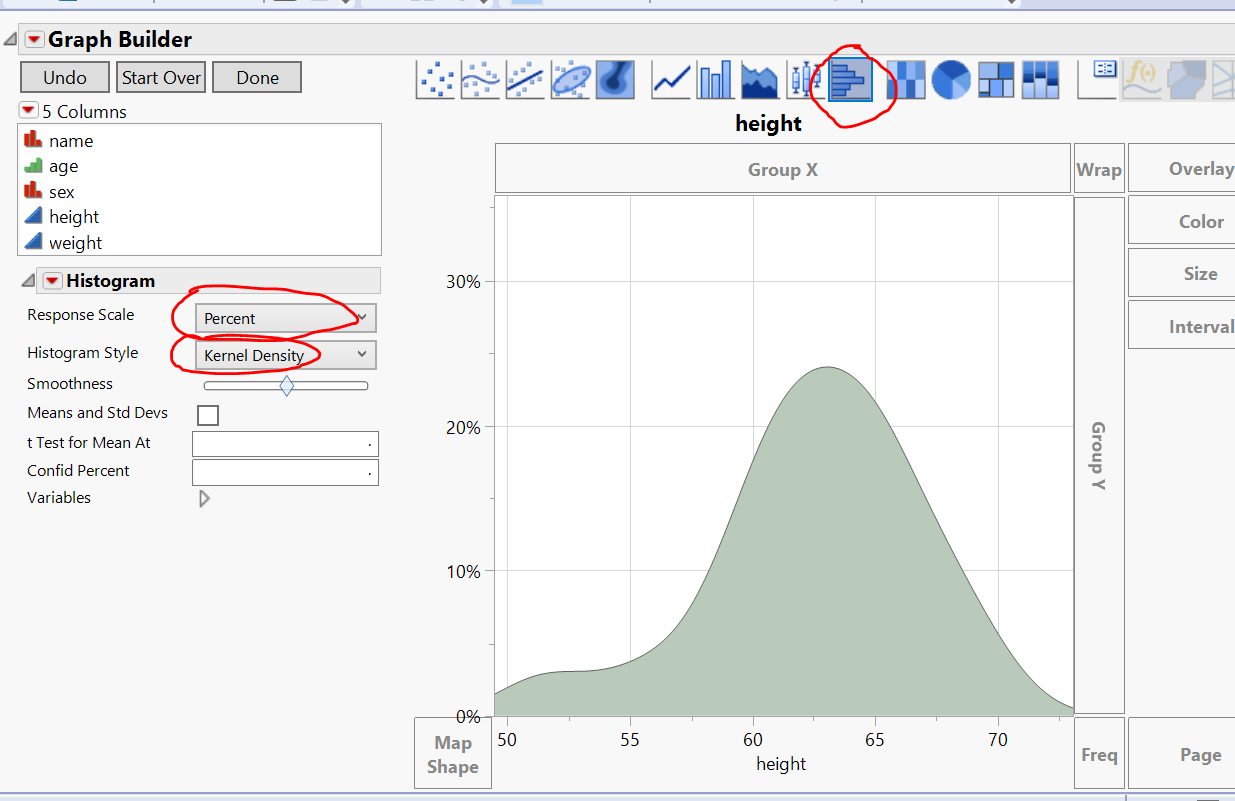
Please see attached, using graph builder to plot probability density function.
2 REPLIES 2

Super User
- Mark as New
- Bookmark
- Subscribe
- Mute
- Subscribe to RSS Feed
- Get Direct Link
- Report Inappropriate Content
Re: Probability density function_pdf
What you need to use, is the Distribution Platform.
Select the column(s) you want, then under the red triangle, select
Display Options=>Horizontal
Histogram Options=>Density Axis
Histogram Options=>Shadowgram

Jim
Level III
Solution
- Mark as New
- Bookmark
- Subscribe
- Mute
- Subscribe to RSS Feed
- Get Direct Link
- Report Inappropriate Content
Re: Probability density function_pdf
Please see attached, using graph builder to plot probability density function.
Recommended Articles
- © 2026 JMP Statistical Discovery LLC. All Rights Reserved.
- Terms of Use
- Privacy Statement
- Contact Us