- Don’t miss your chance to experience Discovery Summit Europe at our best available rate! Early bird registration through 31 Oct.
- Image to Table JMP extension imports single or batch images as data tables. Useful to extract curves from pictures or convert image data to curve data to use in analyses like Functional Data Explorer. Download and install the extension.
- Subscribe to RSS Feed
- Mark Topic as New
- Mark Topic as Read
- Float this Topic for Current User
- Bookmark
- Subscribe
- Mute
- Printer Friendly Page
Discussions
Solve problems, and share tips and tricks with other JMP users.- User Community
- :
- Discussions
- :
- Plot only the filtered data from a given column on a dashboard

- Mark as New
- Bookmark
- Subscribe
- Mute
- Subscribe to RSS Feed
- Get Direct Link
- Report Inappropriate Content
Plot only the filtered data from a given column on a dashboard
Hi,
I am trying to build a dash board that will plot relevant graphs.
My current issue is that it plots the entire data on one graph, highlights the filtered data and the rest is grayed out.
I want to graph to be build only with the data of the relevant rows of the given column.
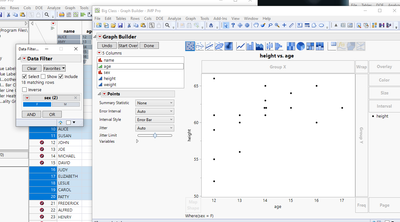
For example, if I want to plot height as a function of age, and I have a column for "sex" which holds 'M' and 'F', so I have the filtering option
for "sex", if I choose 'F', the 'M' data will be grayed out. I want the chart to only show the 'F' data.
How do I do that?
Thanks,


- Mark as New
- Bookmark
- Subscribe
- Mute
- Subscribe to RSS Feed
- Get Direct Link
- Report Inappropriate Content
Re: Plot only the filtered data from a given column on a dashboard
Change the filter settings (enable Include / Show depending on your use case)
Edit:
This explains the different modes https://www.jmp.com/support/help/en/17.2/#page/jmp/filtering-modes.shtml#ww609720 (select isn't available for local data filter)

- Mark as New
- Bookmark
- Subscribe
- Mute
- Subscribe to RSS Feed
- Get Direct Link
- Report Inappropriate Content
Re: Plot only the filtered data from a given column on a dashboard
@jthi wrote:select isn't available for local data filter
... but there is a wish to change that:
Local Data Filter - don't disable the SELECT option (:green_heart:)
would be quite helpful! -> plese click on the link and vote :)
- Mark as New
- Bookmark
- Subscribe
- Mute
- Subscribe to RSS Feed
- Get Direct Link
- Report Inappropriate Content
Re: Plot only the filtered data from a given column on a dashboard
Thanks for the reply folks,
But I'm looking for a JSL code lines to do that, not by the options I have in a graph.
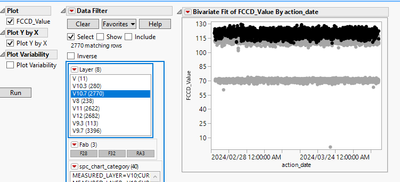
To better explain myself, my code gives the user the choosing options shown below.
When the user chooses V10.7 it highlights the relevant rows under column "Layer".
I want the graph to be shown only after the user chose the layer, and show only the chosen data.
- Mark as New
- Bookmark
- Subscribe
- Mute
- Subscribe to RSS Feed
- Get Direct Link
- Report Inappropriate Content
Re: Plot only the filtered data from a given column on a dashboard
Do it first by hand and then get the script
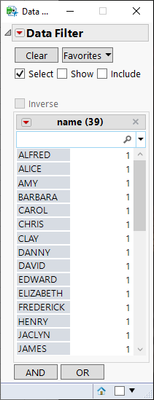
add show
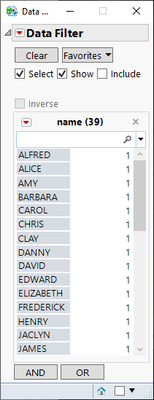
go to red triangle menu and save script
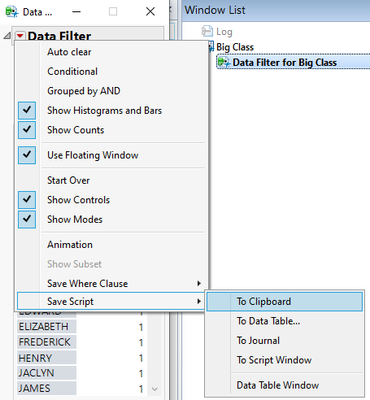
Current Data Table() << Data Filter(
	Location({1104, 309}),
	Mode(Show(1)),
	Add Filter(columns(:name), Display(:name, N Items(15), Find(Set Text(""))))
)
You can also go and check Data Filter from scripting index
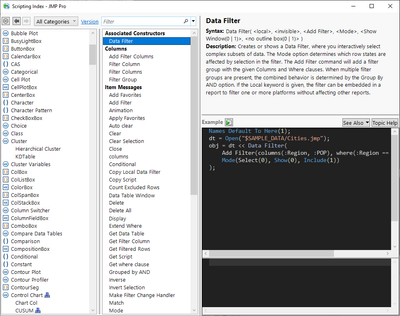
and from there you easily get to documentation by pressing Help https://www.jmp.com/support/help/en/17.2/#page/jmp/data-table-messages.shtml?os=win&source=applicati... and https://www.jmp.com/support/help/en/17.2/#page/jmp/add-a-data-filter.shtml#ww795815
Recommended Articles
- © 2026 JMP Statistical Discovery LLC. All Rights Reserved.
- Terms of Use
- Privacy Statement
- Contact Us