- Learn how to build custom Python data connectors and further customize JMP’s Data Connector Framework with the Python Data Connector Demo, available now in the JMP Marketplace!
- See how to use Accelerated Life Testing (ALT) to evaluate reliability. Register for June 5 webinar, 2pm US Eastern Time.
- Subscribe to RSS Feed
- Mark Topic as New
- Mark Topic as Read
- Float this Topic for Current User
- Bookmark
- Subscribe
- Mute
- Printer Friendly Page
Discussions
Solve problems, and share tips and tricks with other JMP users.- JMP User Community
- :
- Discussions
- :
- Model Validation in JMP Statistical Software as compared to MODDE

- Mark as New
- Bookmark
- Subscribe
- Mute
- Subscribe to RSS Feed
- Get Direct Link
- Report Inappropriate Content
Model Validation in JMP Statistical Software as compared to MODDE
Hi there,
I am reaching out to seek some clarification on a feature in the JMP statistical software.
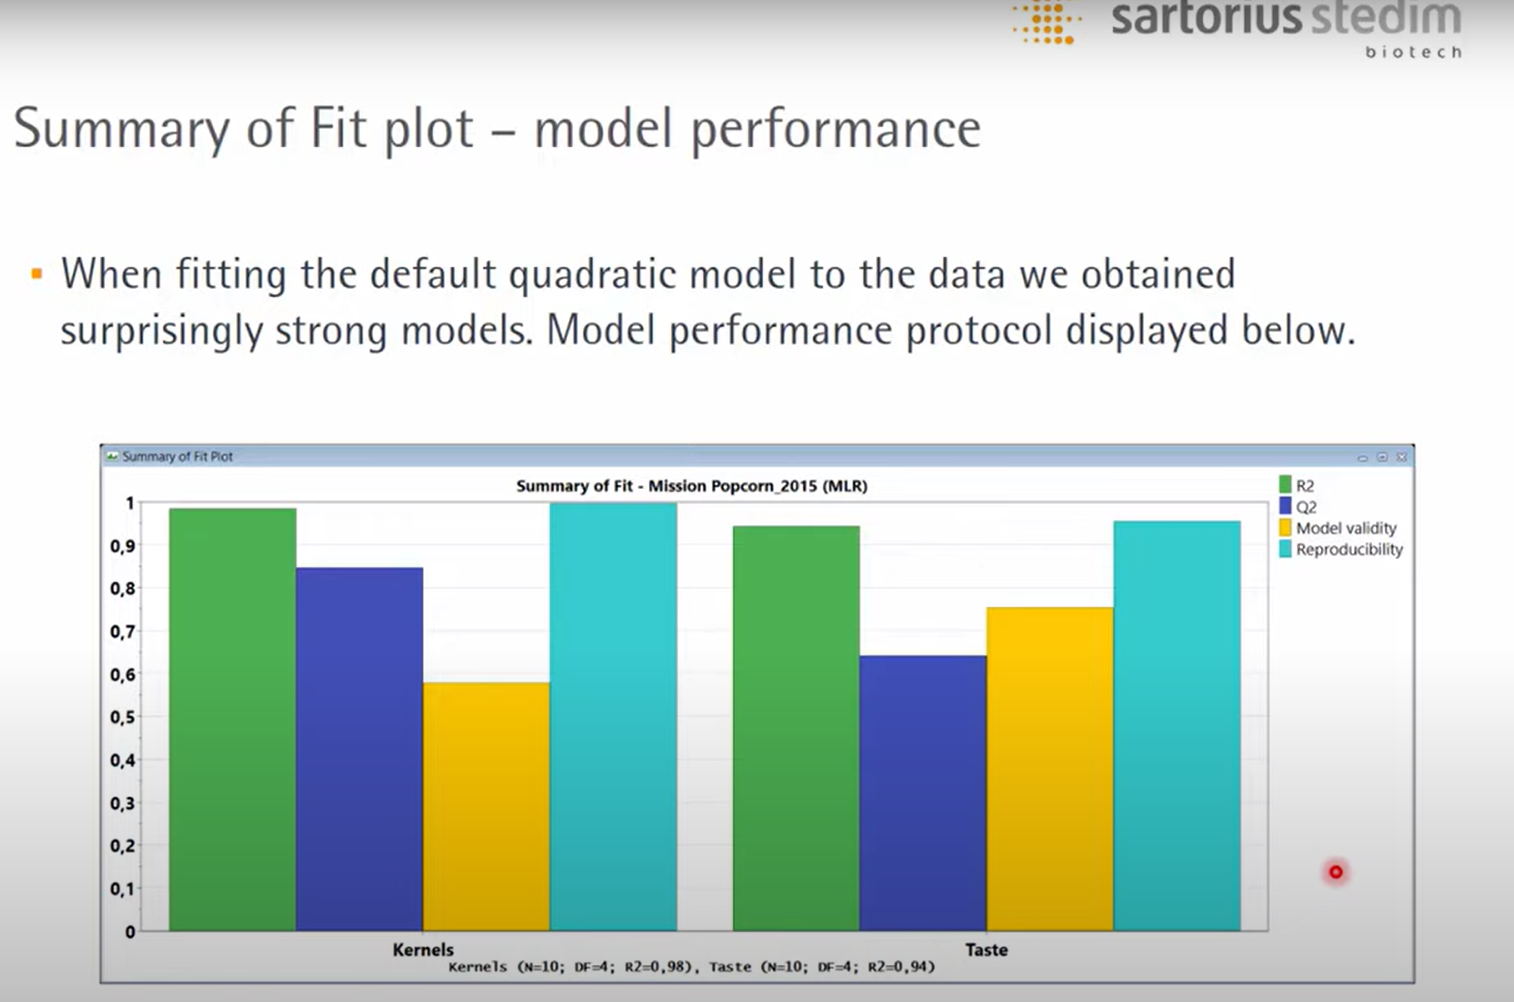
In MODDE, we find a valuable capability for model validation, allowing us to scrutinize and validate the model used to run and analyze a Design of Experiments (DoE). This functionality is presented in an intuitive graphical user interface (GUI) manner, facilitating a seamless user experience Please refer the attached image or to minute 21:15 in the linked video for further details - https://www.youtube.com/watch?v=UTYRpStJDE8
However, I've been exploring JMP for similar functionalities, and I am yet to discover a straightforward method for model validation. While JMP is excellent for executing DoE analyses, it appears to lack a built-in mechanism to validate the model it employs during the analysis.
Could you kindly shed some light on whether JMP offers a feature similar to MODDE for validating the DoE model? If so, I would greatly appreciate guidance on how to access and utilize this feature.
Thank you for your time and assistance. I look forward to your insights on this matter.

Accepted Solutions

- Mark as New
- Bookmark
- Subscribe
- Mute
- Subscribe to RSS Feed
- Get Direct Link
- Report Inappropriate Content
Re: Model Validation in JMP Statistical Software as compared to MODDE
Hi @PieAnteater793,
Most of the responses can be found in the answer from @peng_liu.
You can explore the different report options in the red triangle from your Fit Model windows to display residuals plots, actual by predicted plot, etc...
Note also that depending on the "emphasis" used in "Fit Model", you may have access to some of the plots you would like to see. For example, when the model emphasis is "Effect screening", you can display "Sorted Parameters Estimates" (accessible in the red triangle options of "Estimates"), which offers a synthetic view of statistical significance and effect size :

Concerning your specific plot, you can recreate it with the Graph Builder, as R² and adjusted R² are available in the "Summary of Fit" panel (righ-click on it, and you can directly create a datatable from it), and R² and R² PRESS (or Q²) are available in the "Press" panel (in the red triangle, go to "Row Diagnostics", then "Press") so you can also create a datatable from it.
From then, combine the tables and you'll have a similar plot using Graph Builder :

.png)
You can calculate Validity and Reproducibility from MODDE in JMP based on the formula from : https://www.sartorius.com/download/544636/modde-12-user-guide-en-b-00090-sartorius-data.pdf
You may not be able to calculate these metrics if you are not able to conduct this test : Lack of Fit
I hope this complementary answer will help,
"It is not unusual for a well-designed experiment to analyze itself" (Box, Hunter and Hunter)

- Mark as New
- Bookmark
- Subscribe
- Mute
- Subscribe to RSS Feed
- Get Direct Link
- Report Inappropriate Content
Re: Model Validation in JMP Statistical Software as compared to MODDE
The plot is a graphical representation of "Summary of Fit". I cannot think of any particular places in JMP that present "Summary of Fit" graphically, but "Summary of Fit" reports (or under related names) are widely available among JMP's analytical platforms.
Rigorously speaking "summary of fit" is not the only way that one can validate a model. Please check out general subjects under the terms such as "Model Comparison", "Model Selection", "Variable Selection", "Cross Validation" among what JMP provides. They are all relevant knowledge for one to build a useful model.
- Mark as New
- Bookmark
- Subscribe
- Mute
- Subscribe to RSS Feed
- Get Direct Link
- Report Inappropriate Content
Re: Model Validation in JMP Statistical Software as compared to MODDE
Hi @PieAnteater793,
Most of the responses can be found in the answer from @peng_liu.
You can explore the different report options in the red triangle from your Fit Model windows to display residuals plots, actual by predicted plot, etc...
Note also that depending on the "emphasis" used in "Fit Model", you may have access to some of the plots you would like to see. For example, when the model emphasis is "Effect screening", you can display "Sorted Parameters Estimates" (accessible in the red triangle options of "Estimates"), which offers a synthetic view of statistical significance and effect size :
Concerning your specific plot, you can recreate it with the Graph Builder, as R² and adjusted R² are available in the "Summary of Fit" panel (righ-click on it, and you can directly create a datatable from it), and R² and R² PRESS (or Q²) are available in the "Press" panel (in the red triangle, go to "Row Diagnostics", then "Press") so you can also create a datatable from it.
From then, combine the tables and you'll have a similar plot using Graph Builder :
You can calculate Validity and Reproducibility from MODDE in JMP based on the formula from : https://www.sartorius.com/download/544636/modde-12-user-guide-en-b-00090-sartorius-data.pdf
You may not be able to calculate these metrics if you are not able to conduct this test : Lack of Fit
I hope this complementary answer will help,
"It is not unusual for a well-designed experiment to analyze itself" (Box, Hunter and Hunter)
- Mark as New
- Bookmark
- Subscribe
- Mute
- Subscribe to RSS Feed
- Get Direct Link
- Report Inappropriate Content
Re: Model Validation in JMP Statistical Software as compared to MODDE
Hi @Victor_G ,
Thank you for hitting the nail on the head with your solution. The hyperlinks really helped. Much appreciated!
Recommended Articles
- © 2026 JMP Statistical Discovery LLC. All Rights Reserved.
- Terms of Use
- Privacy Statement
- Contact Us