- JMP Statement Regarding Critical PHP Remote Code Execution Vulnerabilities (CVE-2026-109618, CVE-2026-109619)
- Don’t miss your chance to experience Discovery Summit Europe at our best available rate! Early bird registration through 31 Oct.
- Graph Builder Toolbar streamlines interactive graphing. Creates shortcuts on Report and GraphBuilder Helpers toolbars. Download and install the extension.
- Subscribe to RSS Feed
- Mark Topic as New
- Mark Topic as Read
- Float this Topic for Current User
- Bookmark
- Subscribe
- Mute
- Printer Friendly Page
Discussions
Solve problems, and share tips and tricks with other JMP users.- User Community
- :
- Discussions
- :
- Proper labels without stacking

- Mark as New
- Bookmark
- Subscribe
- Mute
- Subscribe to RSS Feed
- Get Direct Link
- Report Inappropriate Content
Proper labels without stacking
Hello,
how can I get proper labels for data without stacking. I cannot stack as I need to see rows dependencies, but on the other hand side need to have for each category only relevant data. I attached also the file.
Accepted Solutions


- Mark as New
- Bookmark
- Subscribe
- Mute
- Subscribe to RSS Feed
- Get Direct Link
- Report Inappropriate Content
Re: Proper labels without stacking
Here is a script which should create the graph (mostly, it doesn't fix legend)
Names Default To Here(1);

dt = Open("$DOWNLOADS/Points.jmp");
dt << Clear Row States; // to remove labels

new_col = dt << New Column("Row", Numeric, Ordinal, Formula(Row()));

new_col << Suppress Eval(1);


gb = dt << Graph Builder(
	Size(1076, 744),
	Show Control Panel(0),
	Variables(Y(:VA), Y(:WA), Group X(:Type), Overlay(:Row)),
	Elements(
		Position(1, 1),
		Box Plot(Y, Overlay(0), Legend(8)),
		Points(Y, Overlay(0), Legend(10)),
		Bar(Y, Legend(12), Bar Style("Float"), Label("Label by Value"))
	),
	Elements(
		Position(1, 2),
		Box Plot(Y, Overlay(0), Legend(9)),
		Points(Y, Overlay(0), Legend(11)),
		Bar(Y, Legend(13), Bar Style("Float"), Label("Label by Value"))
	),
	SendToReport(
		Dispatch(
			{},
			"Graph Builder",
			FrameBox,
			{DispatchSeg(BarSeg(1), {Set Width Proportion(0.00005)})}
		),
		Dispatch(
			{},
			"Graph Builder",
			FrameBox(2),
			{DispatchSeg(BarSeg(1), {Set Width Proportion(0.000001)})}
		),
		Dispatch(
			{},
			"Graph Builder",
			FrameBox(3),
			{DispatchSeg(BarSeg(1), {Set Width Proportion(0.000001)})}
		),
		Dispatch(
			{},
			"Graph Builder",
			FrameBox(4),
			{DispatchSeg(BarSeg(1), {Set Width Proportion(0.000001)})}
		),
		Dispatch(
			{},
			"Graph Builder",
			FrameBox(5),
			{DispatchSeg(BarSeg(1), {Set Width Proportion(0.000001)})}
		),
		Dispatch(
			{},
			"Graph Builder",
			FrameBox(6),
			{DispatchSeg(BarSeg(1), {Set Width Proportion(0.000001)})}
		),
		Dispatch(
			{},
			"400",
			LegendBox,
			{Legend Position(
				{8, [0, -3], 10, [2], 12, [4, 5, 6, 7, 8, 9, 10, 11, 12, 13, 14, 15, 16, 17, 18,
				19, 20, 21, 22, 23, 24, 25, 26], 9, [1, -3], 11, [3], 13, [-3, -3, -3, -3, -3,
				-3, -3, -3, -3, -3, -3, -3, -3, -3, -3, -3, -3, -3, -3, -3, -3, -3, -3]}
			)}
		)
	)
);
Important things are setting variables for graph builder
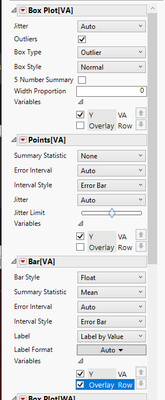
and customizing each bar segments width proportion to be much smaller
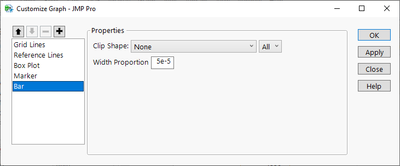
and you end up with


and if you need classification I would maybe consider modifying the marker
- Mark as New
- Bookmark
- Subscribe
- Mute
- Subscribe to RSS Feed
- Get Direct Link
- Report Inappropriate Content
Re: Proper labels without stacking
What are "proper labels" in this case?
- Mark as New
- Bookmark
- Subscribe
- Mute
- Subscribe to RSS Feed
- Get Direct Link
- Report Inappropriate Content
Re: Proper labels without stacking
Hi, please see attached.

- Mark as New
- Bookmark
- Subscribe
- Mute
- Subscribe to RSS Feed
- Get Direct Link
- Report Inappropriate Content
Re: Proper labels without stacking
See here stacked...
- Mark as New
- Bookmark
- Subscribe
- Mute
- Subscribe to RSS Feed
- Get Direct Link
- Report Inappropriate Content
Re: Proper labels without stacking
One option is to add new column which has the row numbers and then use that as overlay for float type of bar charts and enable labels on those. Then use customize to make those "bar charts" smaller and hide extra values from legend. (This is is very annoying to do though)
- Mark as New
- Bookmark
- Subscribe
- Mute
- Subscribe to RSS Feed
- Get Direct Link
- Report Inappropriate Content
Re: Proper labels without stacking
Hi, can you please show me how please?
- Mark as New
- Bookmark
- Subscribe
- Mute
- Subscribe to RSS Feed
- Get Direct Link
- Report Inappropriate Content
Re: Proper labels without stacking
Here is a script which should create the graph (mostly, it doesn't fix legend)
Names Default To Here(1);

dt = Open("$DOWNLOADS/Points.jmp");
dt << Clear Row States; // to remove labels

new_col = dt << New Column("Row", Numeric, Ordinal, Formula(Row()));

new_col << Suppress Eval(1);


gb = dt << Graph Builder(
	Size(1076, 744),
	Show Control Panel(0),
	Variables(Y(:VA), Y(:WA), Group X(:Type), Overlay(:Row)),
	Elements(
		Position(1, 1),
		Box Plot(Y, Overlay(0), Legend(8)),
		Points(Y, Overlay(0), Legend(10)),
		Bar(Y, Legend(12), Bar Style("Float"), Label("Label by Value"))
	),
	Elements(
		Position(1, 2),
		Box Plot(Y, Overlay(0), Legend(9)),
		Points(Y, Overlay(0), Legend(11)),
		Bar(Y, Legend(13), Bar Style("Float"), Label("Label by Value"))
	),
	SendToReport(
		Dispatch(
			{},
			"Graph Builder",
			FrameBox,
			{DispatchSeg(BarSeg(1), {Set Width Proportion(0.00005)})}
		),
		Dispatch(
			{},
			"Graph Builder",
			FrameBox(2),
			{DispatchSeg(BarSeg(1), {Set Width Proportion(0.000001)})}
		),
		Dispatch(
			{},
			"Graph Builder",
			FrameBox(3),
			{DispatchSeg(BarSeg(1), {Set Width Proportion(0.000001)})}
		),
		Dispatch(
			{},
			"Graph Builder",
			FrameBox(4),
			{DispatchSeg(BarSeg(1), {Set Width Proportion(0.000001)})}
		),
		Dispatch(
			{},
			"Graph Builder",
			FrameBox(5),
			{DispatchSeg(BarSeg(1), {Set Width Proportion(0.000001)})}
		),
		Dispatch(
			{},
			"Graph Builder",
			FrameBox(6),
			{DispatchSeg(BarSeg(1), {Set Width Proportion(0.000001)})}
		),
		Dispatch(
			{},
			"400",
			LegendBox,
			{Legend Position(
				{8, [0, -3], 10, [2], 12, [4, 5, 6, 7, 8, 9, 10, 11, 12, 13, 14, 15, 16, 17, 18,
				19, 20, 21, 22, 23, 24, 25, 26], 9, [1, -3], 11, [3], 13, [-3, -3, -3, -3, -3,
				-3, -3, -3, -3, -3, -3, -3, -3, -3, -3, -3, -3, -3, -3, -3, -3, -3, -3]}
			)}
		)
	)
);
Important things are setting variables for graph builder
and customizing each bar segments width proportion to be much smaller
and you end up with
and if you need classification I would maybe consider modifying the marker
- Mark as New
- Bookmark
- Subscribe
- Mute
- Subscribe to RSS Feed
- Get Direct Link
- Report Inappropriate Content
Re: Proper labels without stacking
Thank you a lot despite I was not able to replicate.
Recommended Articles
- © 2026 JMP Statistical Discovery LLC. All Rights Reserved.
- Terms of Use
- Privacy Statement
- Contact Us