- Don’t miss your chance to experience Discovery Summit Europe at our best available rate! Early bird registration through 31 Oct.
- Graph Builder Toolbar streamlines interactive graphing. Creates shortcuts on Report and GraphBuilder Helpers toolbars. Download and install the extension.
- Subscribe to RSS Feed
- Mark Topic as New
- Mark Topic as Read
- Float this Topic for Current User
- Bookmark
- Subscribe
- Mute
- Printer Friendly Page
Discussions
Solve problems, and share tips and tricks with other JMP users.- User Community
- :
- Discussions
- :
- Re: Jmp17 boxplot points spread

- Mark as New
- Bookmark
- Subscribe
- Mute
- Subscribe to RSS Feed
- Get Direct Link
- Report Inappropriate Content
Jmp17 boxplot points spread
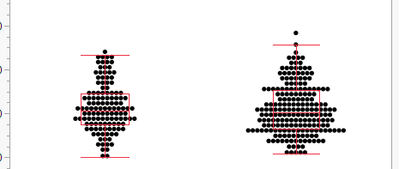
HI, I just moved from JMP16 to JMP17. While doing my boxplots i noticed that the points into the boxpltos are arranged in a weird way , they appears aligned in rows and if I chosse the points spread option the graph becomes completely un-readable.
this is an example of the non spread case:
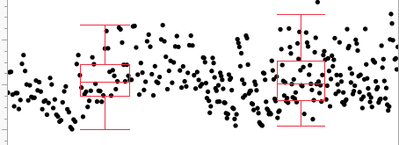
if i activate the points spread option the same plots becomes this way:
no need to say that is useless
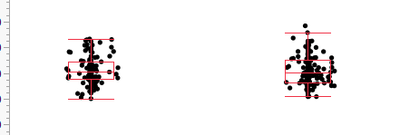
is there any way to have the same as in JMP16 which is this here?
Accepted Solutions


- Mark as New
- Bookmark
- Subscribe
- Mute
- Subscribe to RSS Feed
- Get Direct Link
- Report Inappropriate Content
Re: Jmp17 boxplot points spread
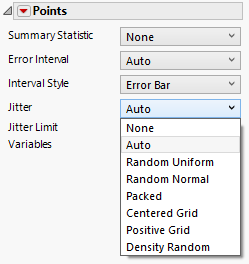
Based on your response to previous posts, I am guessing that you are using the boxplots in Fit Y by X. The Display Options from the red popup menu only offers Points Spread and Points Jittered which gives you the two pictures you shared. However, use Points Jittered. Then right-click on the graph and choose Customize. In the dialog that appears, click on Marker and then you can choose the different jittering options. The default is the Centered Grid.
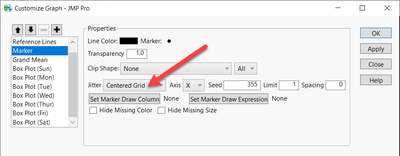
I think you want Random Uniform. I don't think it will look exactly like version 16, but it is pretty close and will keep the points from running into each other.


- Mark as New
- Bookmark
- Subscribe
- Mute
- Subscribe to RSS Feed
- Get Direct Link
- Report Inappropriate Content
Re: Jmp17 boxplot points spread
Hi @GG74 ,
Instead of the 'Points Spread' option, you may want to try setting 'Points Jittered' to a jitter option that looks good for your data.
Hope this helps,
~John
- Mark as New
- Bookmark
- Subscribe
- Mute
- Subscribe to RSS Feed
- Get Direct Link
- Report Inappropriate Content
Re: Jmp17 boxplot points spread
Hi, the "points jittered" option is always activated, and the results are the one you see.
this is not the solution, thanks for your interest

- Mark as New
- Bookmark
- Subscribe
- Mute
- Subscribe to RSS Feed
- Get Direct Link
- Report Inappropriate Content
Re: Jmp17 boxplot points spread
He's saying to choose a different "jitter" option.
- Mark as New
- Bookmark
- Subscribe
- Mute
- Subscribe to RSS Feed
- Get Direct Link
- Report Inappropriate Content
Re: Jmp17 boxplot points spread
I did not get initially your suggestion, sorry about that.
GG
- Mark as New
- Bookmark
- Subscribe
- Mute
- Subscribe to RSS Feed
- Get Direct Link
- Report Inappropriate Content
Re: Jmp17 boxplot points spread
Sorry @GG74 ,
I should have posted a screenshot like Dan did. I assumed you were using Fit Y by X and was suggesting to choose "Points Jittered" from the red triangle menu:
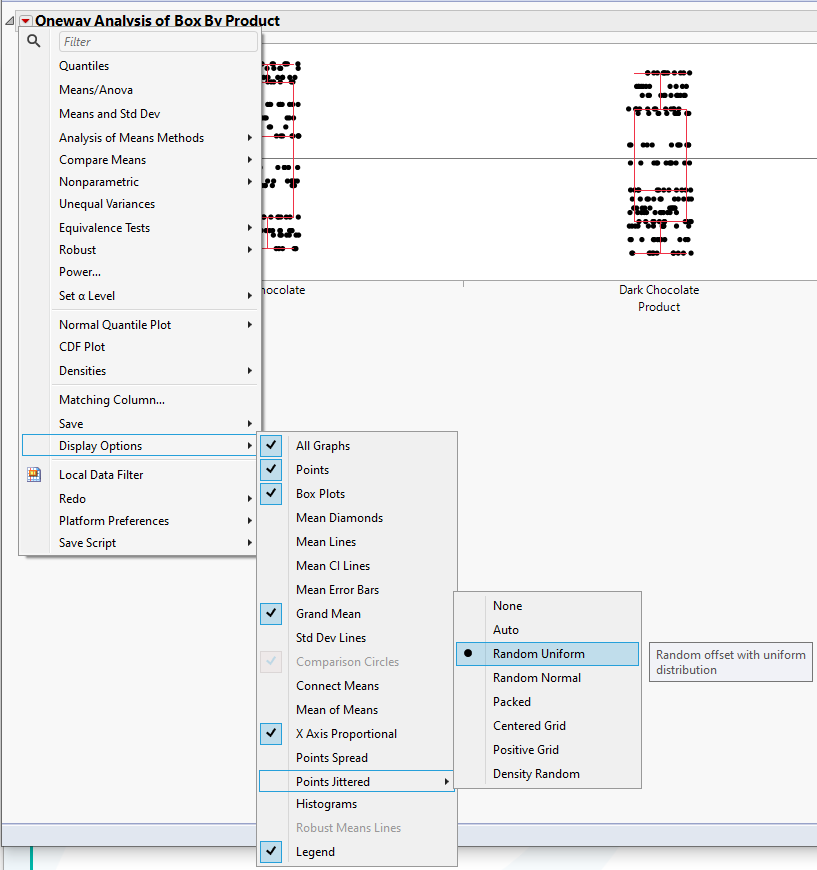
What's good about Dan's solution is that you can adjust the jittering 'Limit' in the Customize dialog (in addition to choosing Random Uniform) to control how much the points are spread horizontally. You might want to choose a value of 0.3 or less to make it look more like JMP 16's jittering.
Dan's solution also works in Graph Builder.
Thanks to everyone who chimed in.
~John

- Mark as New
- Bookmark
- Subscribe
- Mute
- Subscribe to RSS Feed
- Get Direct Link
- Report Inappropriate Content
Re: Jmp17 boxplot points spread
I'm having trouble understanding your question. Your first and third graphs don't look like they are using the same data - are they? Perhaps the solution offered by mmarchandTSI is what you are after, but I couldn't tell exactly what you are objecting to. Points spread certainly doesn't seem like what you want. When I use my data and use points jittered the graphs look fine, so can you explain exactly what you don't like about the first graph? Also, is this being produced in Graph Builder or some other platform?
- Mark as New
- Bookmark
- Subscribe
- Mute
- Subscribe to RSS Feed
- Get Direct Link
- Report Inappropriate Content
Re: Jmp17 boxplot points spread
Based on your response to previous posts, I am guessing that you are using the boxplots in Fit Y by X. The Display Options from the red popup menu only offers Points Spread and Points Jittered which gives you the two pictures you shared. However, use Points Jittered. Then right-click on the graph and choose Customize. In the dialog that appears, click on Marker and then you can choose the different jittering options. The default is the Centered Grid.
I think you want Random Uniform. I don't think it will look exactly like version 16, but it is pretty close and will keep the points from running into each other.
Recommended Articles
- © 2026 JMP Statistical Discovery LLC. All Rights Reserved.
- Terms of Use
- Privacy Statement
- Contact Us