- Don’t miss your chance to experience Discovery Summit Europe at our best available rate! Early bird registration through 31 Oct.
- Graph Builder Toolbar streamlines interactive graphing. Creates shortcuts on Report and GraphBuilder Helpers toolbars. Download and install the extension.
- Subscribe to RSS Feed
- Mark Topic as New
- Mark Topic as Read
- Float this Topic for Current User
- Bookmark
- Subscribe
- Mute
- Printer Friendly Page
Discussions
Solve problems, and share tips and tricks with other JMP users.- User Community
- :
- Discussions
- :
- Re: [JSL] Script for Two-One Side T-Test on a large number of metrics

- Mark as New
- Bookmark
- Subscribe
- Mute
- Subscribe to RSS Feed
- Get Direct Link
- Report Inappropriate Content
[JSL] Script for Two-One Side T-Test on a large number of metrics
Hello All,
I would like to write a JSL script to automate a TOST (Two-One Side T-Test) on a large number of metrics (500+).
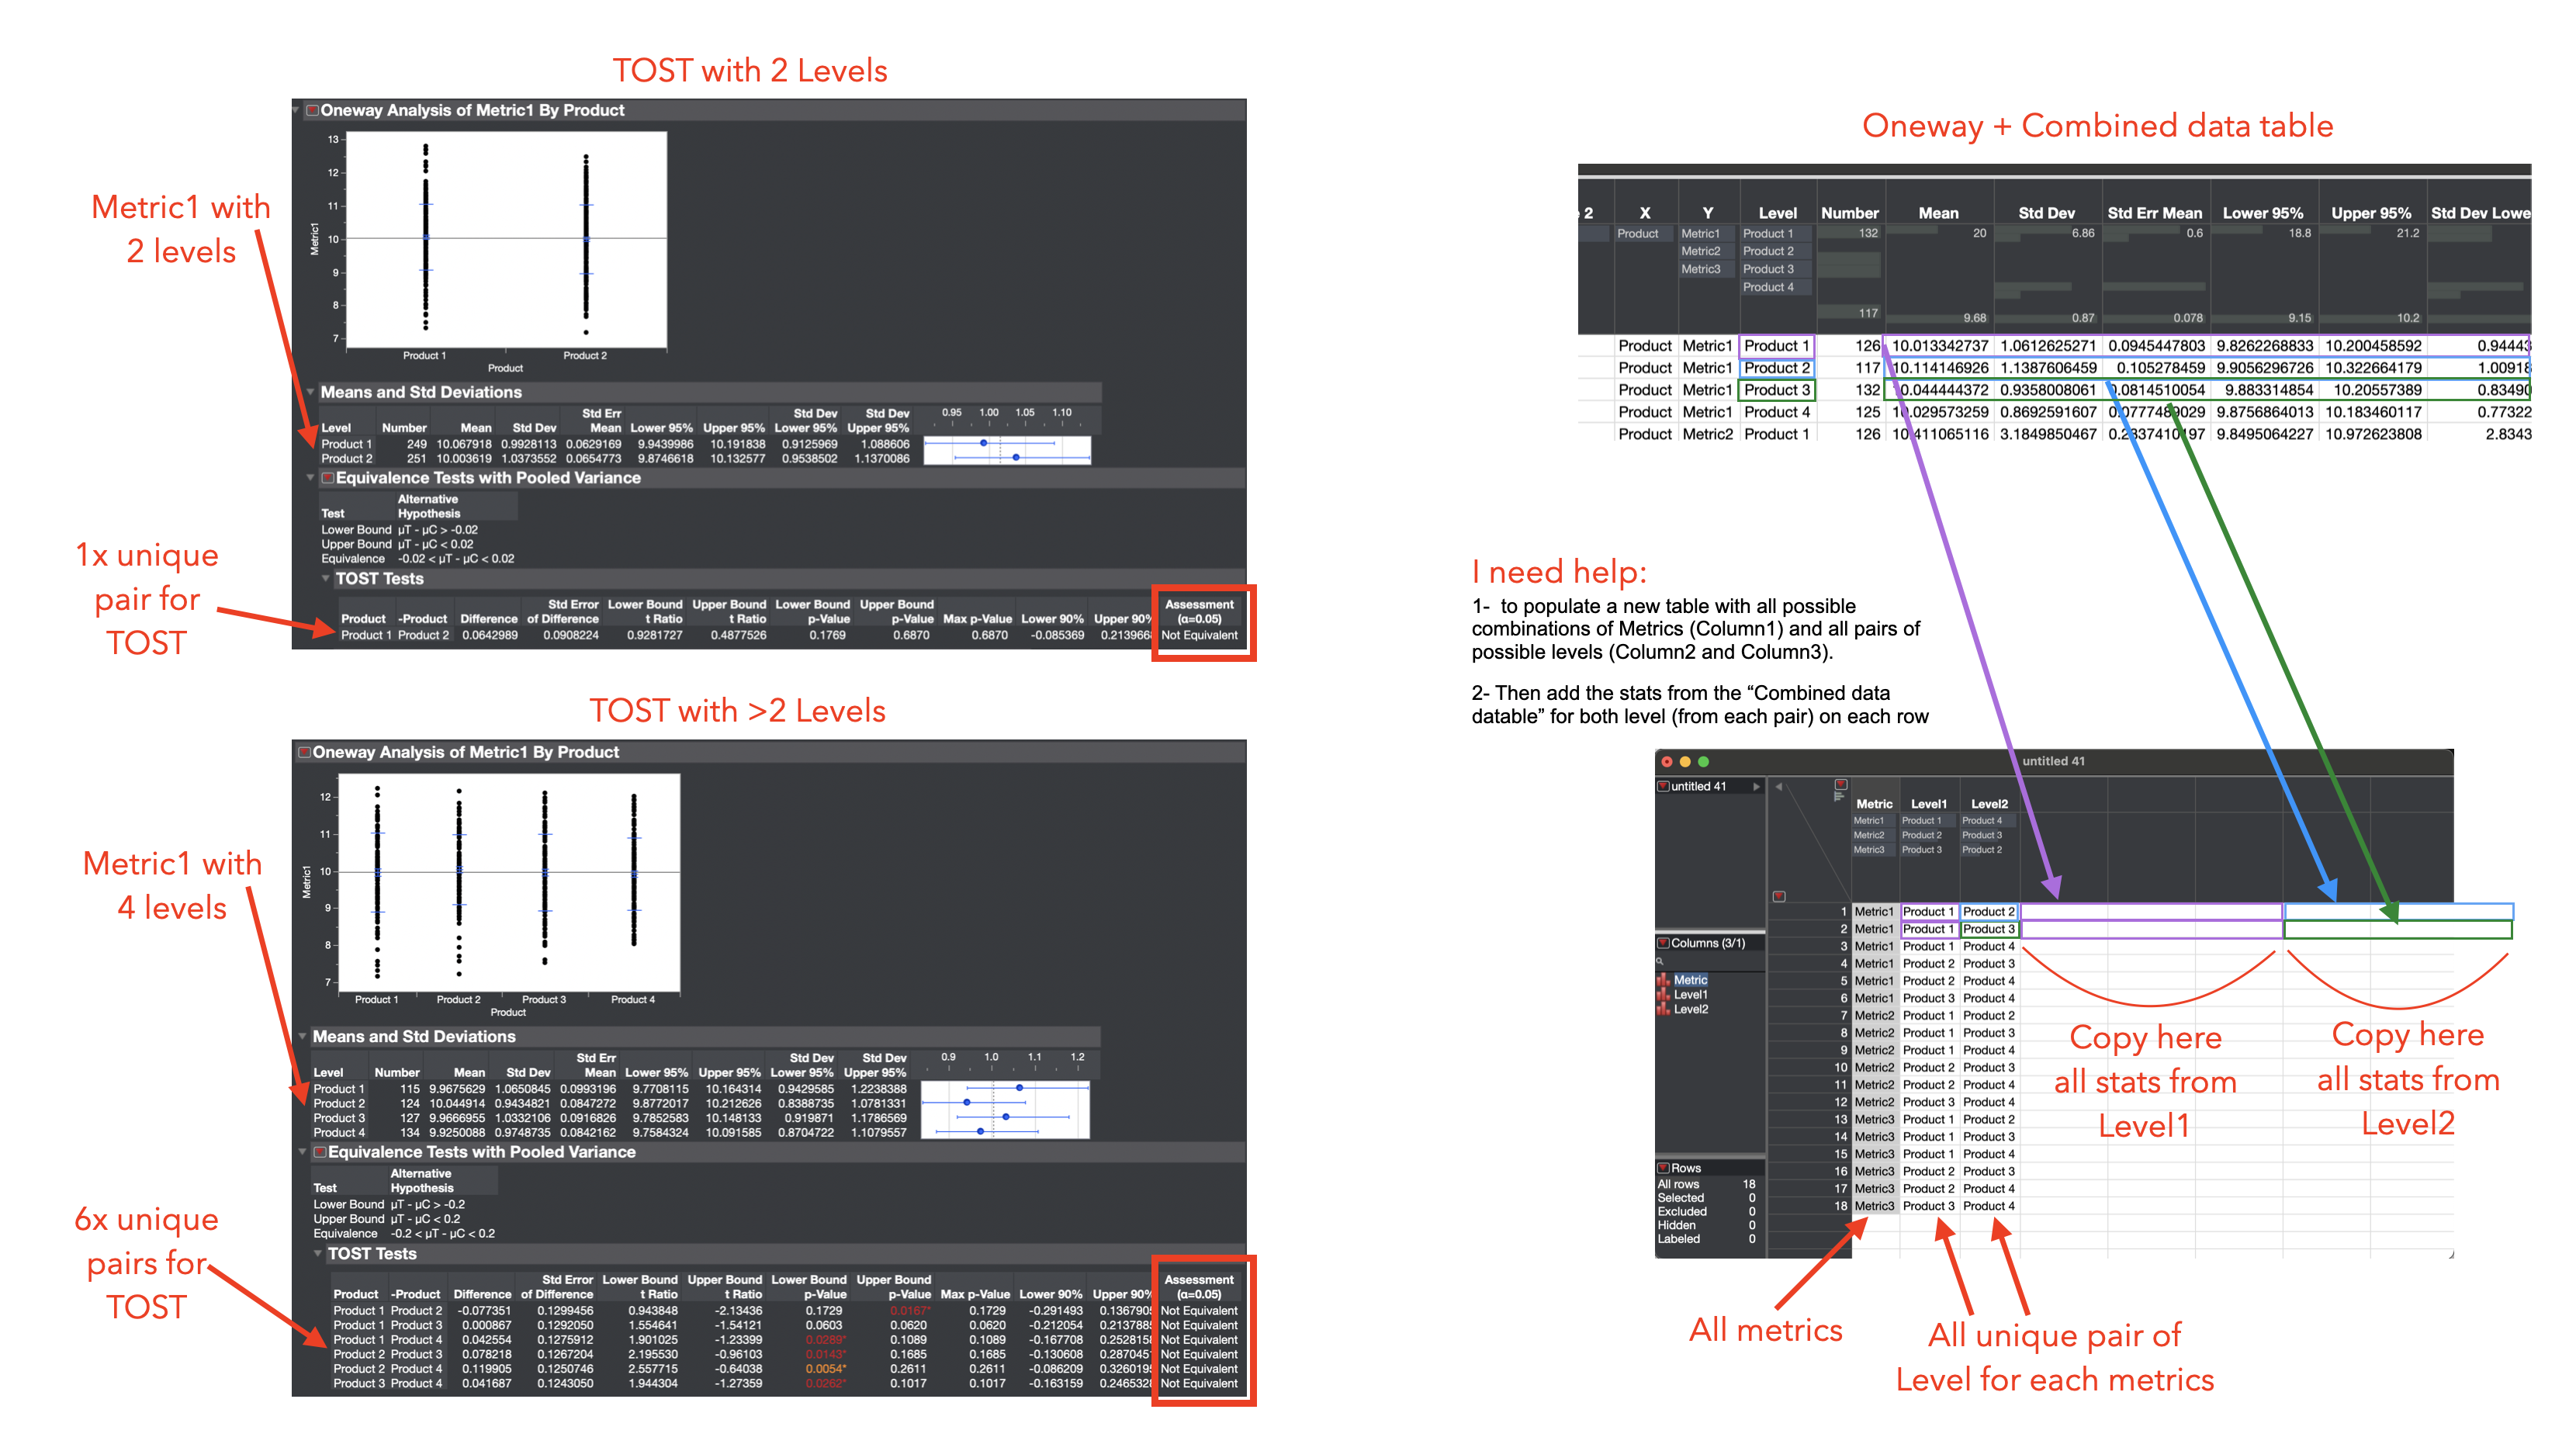
The TOST works by pair of “levels”, so working with 2x levels is easy, because it requires only 1x row per “pair”.
I already wrote a script that works well for 2x levels by generating a “Combined data table” and adding more columns with formula to it, which end up with the results: “Equivalent” or “Not Equivalent”.
The problem thickens when I want to work with more than 2x Levels, it would require to find all possible unique pairs of “Levels” and then run the TOST math for every combination of Metric + pairs of Levels.
I found a way (on this forum) to find all possible unique pairs from a list and put them in a table or in a nested list (NchooseKmatrix()).
But I am stuck there. What I need is:
1- to populate a new table with all possible combinations of Metrics (Column1) and all pairs of possible levels (Column2 and Column3).
2- Then add the stats for each pair of level on each row
From this point I will be able to figure out the math to finalize the TOST.
I have attached a script that generates a dummy table, then a combined data table from the Oneway analysis, then my unsuccessful attempt of creating a third table with all combinations of Metrics + Unique pairs of level
Thanks in advance for your help
Names Default To Here( 1 );
clear symbols();
Deletesymbols();

//Create table with random distribution (table 1)
dt = New Table( "tabletest",
	Add Rows( 500 ),
	New Column( "Product", Character, "Nominal", formula("Product " ||char( Random Integer( 1, 4 )))),
	New Column( "Metric1", Numeric, "Continuous", formula( Random Normal( 10, 1 ) ) ),
	New Column( "Metric2", Numeric, "Continuous", formula( Random Gamma( 10, 1 ) ) ),
	New Column( "Metric3", Numeric, "Continuous", formula( Random Gamma( 10, 2 ) ) )


);
Column( dt, "Metric1" ) << set property( "spec limits", {LSL( 5 ), USL( 25 ), Show Limits( 0 )} );
Column( dt, "Metric2" ) << set property( "spec limits", {LSL( 0 ), USL( 40 ), Show Limits( 0 )} );
Column( dt, "Metric3" ) << set property( "spec limits", {LSL( 5 ), USL( 40 ), Show Limits( 0 )} );

dt << save( "$Desktop\tabletest.jmp" );

//Get a list from all unique Product

SplitBy = "Product";
summarize(ColumnSplitBy=by(Column (SplitBy)));
show(ColumnSplitBy);
For( i = N Items( ColumnSplitBy ), i > 0, i--,
  If( ColumnSplitBy[i] == "",
  Remove From( ColumnSplitBy, i, 1 );
  )
);

//Get Column name
MetricCols = dt << Get Column Names( numeric, continuous, "string" );

//Get all unique combo of 2 Products
ColumnSplitByCombo = aslist( nchoosekMatrix(nitems(ColumnSplitBy), 2));
show (ColumnSplitByCombo);


//Create a combinaed datatable with stats (Table 2)
ow = dt << Oneway(
	Y(Eval(MetricCols)),
	X(Eval(SplitBy)),
	Means and Std Dev(1),
	SendToReport(
		Dispatch(
			{"Means and Std Deviations"},
			"Std Dev Lower 95%",
			NumberColBox,
			{Visibility("Visible")}
		),
		Dispatch(
			{"Means and Std Deviations"},
			"Std Dev Upper 95%",
			NumberColBox,
			{Visibility("Visible")}
		)
	),
	Invisible
);

tb = Report(ow[1])[Outline Box("Means and Std Deviations"), Table Box(1)];
dt2 = tb << Make Combined Data Table;
tb << close window;

//Create new table for the result, each row has a unique pair of Levels
dt3 = astable( nchoosekMatrix(nitems(ColumnSplitBy), 2), << column names({"x", "y"}) );
dt3 << new column ("first", character, << set values ( ColumnSplitBy[dt3:x << get values]));
dt3 << new column ("second", character, << set values ( ColumnSplitBy[dt3:y << get values]));
dt3 << delete columns (1::2);

//Create a nested list with each pair of levels
Listdt3 = aslist( nchoosekMatrix(nitems(ColumnSplitBy), 2));
show (Listdt3);

// I tried to use associate array() to match the level and name but couldn't make it work
-Voiz
- Mark as New
- Bookmark
- Subscribe
- Mute
- Subscribe to RSS Feed
- Get Direct Link
- Report Inappropriate Content
Re: [JSL] Script for Two-One Side T-Test on a large number of metrics
Hello MRB3855,
You make an excellent point, I didn't want to put too much info in my first message to focus on my script problem, but in my initial code (that work for 2 levels), I set the equivalence limits as 5% of the range [LSL;USL].
This is of course an arbitrary value that I can change if necessary.
It allows me to sift through hundreds+ of metrics and flag the "Not Equivalent" metrics from this criteria which are typically a dozen.
Then from this list I can run a thorough analysis:
- Analysis of Variance
- TOST with a proper range
- etc...
To you second point, If I understand well, you suggest to run the TOST platform for each metrics and pick the data and place into a table via Display Box()? If so, that is indeed a possible solution but I'd prefer run the math myself to understand the TOST principle and also save some processing time.
Hope it makes sense :)
Thanks for helping
-Voiz


- Mark as New
- Bookmark
- Subscribe
- Mute
- Subscribe to RSS Feed
- Get Direct Link
- Report Inappropriate Content
Re: [JSL] Script for Two-One Side T-Test on a large number of metrics
Is there a reason you cannot use the built-in equivalence test in the Oneway platform?
- Mark as New
- Bookmark
- Subscribe
- Mute
- Subscribe to RSS Feed
- Get Direct Link
- Report Inappropriate Content
Re: [JSL] Script for Two-One Side T-Test on a large number of metrics
Hello Mark,
Yes at first I thought of using the TOST platform and pick the stats with Display Box(), but I preferred the different approach to calculate each parameters individually to achieve the same results as the platform gives.
After the fact, it would maybe have been a faster approach than reinventing the wheel but I have now invested so much time into this, and I am so close of achieving it that I might as well finish what I started (the hard way), haha!
One benefit from this is that I now understand each step of the TOST method.
Thanks
-Voiz


- Mark as New
- Bookmark
- Subscribe
- Mute
- Subscribe to RSS Feed
- Get Direct Link
- Report Inappropriate Content
Re: [JSL] Script for Two-One Side T-Test on a large number of metrics
Hi @Voizingu All said, it seems you have a solution that works for you. Excellent! However, so it doesn’t get lost, the confidence interval should be a 100(1-2alpha)% interval. I.e., if you want your type 1 error rate to be 5% then the interval used to judge equivalence should be a 90% confidence interval (not 95%). It is a Two One Sided Test…each side tested at alpha = 0.05. See attached,
- « Previous
-
- 1
- 2
- Next »
Recommended Articles
- © 2026 JMP Statistical Discovery LLC. All Rights Reserved.
- Terms of Use
- Privacy Statement
- Contact Us