Turn on suggestions
Auto-suggest helps you quickly narrow down your search results by suggesting possible matches as you type.
- JMP Statement Regarding Critical PHP Remote Code Execution Vulnerabilities (CVE-2026-109618, CVE-2026-109619)
- Don’t miss your chance to experience Discovery Summit Europe at our best available rate! Early bird registration through 31 Oct.
- Graph Builder Toolbar streamlines interactive graphing. Creates shortcuts on Report and GraphBuilder Helpers toolbars. Download and install the extension.
Options
- Subscribe to RSS Feed
- Mark Topic as New
- Mark Topic as Read
- Float this Topic for Current User
- Bookmark
- Subscribe
- Mute
- Printer Friendly Page
Discussions
Solve problems, and share tips and tricks with other JMP users.- User Community
- :
- Discussions
- :
- Interpretation of JMP GR&R result table in JMP 15.1.0

Level I
- Mark as New
- Bookmark
- Subscribe
- Mute
- Subscribe to RSS Feed
- Get Direct Link
- Report Inappropriate Content
Interpretation of JMP GR&R result table in JMP 15.1.0
Created:
Oct 23, 2020 08:46 PM
| Last Modified: Jun 10, 2023 4:21 PM
(4397 views)
Hi Community of Experienced Users!
I am a new to JMP and trying to interpret the Gauge R&R results.
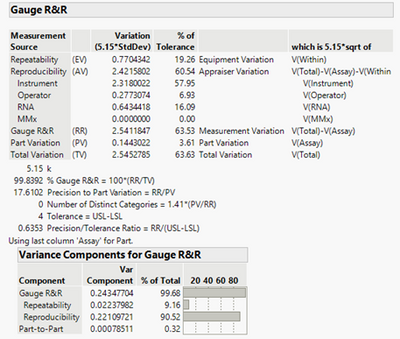
When I look at the Result table: could you explain why Reproducibility is 60.54 %, if the formula for calculation is V(total)- V(Assay) -V(Within)? When I apply this formula, I am getting: 63.63 (Total)-3.61 (Assay) - 19.26 ( Within) =40.76.
Could you please help? The second question is what is categorized into "equipment variation"? Thank you!
2 REPLIES 2


Staff
- Mark as New
- Bookmark
- Subscribe
- Mute
- Subscribe to RSS Feed
- Get Direct Link
- Report Inappropriate Content
Re: Interpretation of JMP GR&R result table in JMP 15.1.0
Did you check the help for Gage R&R yet?

Level VII
- Mark as New
- Bookmark
- Subscribe
- Mute
- Subscribe to RSS Feed
- Get Direct Link
- Report Inappropriate Content
Re: Interpretation of JMP GR&R result table in JMP 15.1.0
It is because the Stdev’s don’t add up to 100%. If you want to look at the % of variation from each component in a way that’s adds up to 100% use the variance component table at the bottom of the output or click on the variance output table for more detailed breakout.
Steve
Steve
Recommended Articles
- © 2026 JMP Statistical Discovery LLC. All Rights Reserved.
- Terms of Use
- Privacy Statement
- Contact Us