- Don’t miss your chance to experience Discovery Summit Europe at our best available rate! Early bird registration through 31 Oct.
- Graph Builder Toolbar streamlines interactive graphing. Creates shortcuts on Report and GraphBuilder Helpers toolbars. Download and install the extension.
- Subscribe to RSS Feed
- Mark Topic as New
- Mark Topic as Read
- Float this Topic for Current User
- Bookmark
- Subscribe
- Mute
- Printer Friendly Page
Discussions
Solve problems, and share tips and tricks with other JMP users.- User Community
- :
- Discussions
- :
- Re: How to write a script to be able to plot any parameters based on the raw dat...

- Mark as New
- Bookmark
- Subscribe
- Mute
- Subscribe to RSS Feed
- Get Direct Link
- Report Inappropriate Content
How to write a script to be able to plot any parameters based on the raw data ?
Hi All,
I was thinking hard about the ways to do automation using JMP recently. Are there any scripts which could do this:-
(1) I have the raw data saved in a JMP table.
(2) I have a script that will automatically plot the graphs (example, var chart) by grabbing any Y variables from the Colume (in the raw data) and plot by a fix X parameter (defined in the script). This will save some time to name all the Y variables in the script, especially when I have ~50 parameters to be added into the script.
Thank you,
Ann
- Mark as New
- Bookmark
- Subscribe
- Mute
- Subscribe to RSS Feed
- Get Direct Link
- Report Inappropriate Content
Re: How to write a script to be able to plot any parameters based on the raw data ?
Thank you so much, Jim.
I was playing around with various codes and scripts for the whole day, but it seemed like I was only able to output the last plot to the pptx. The rest of the plots were not saved to the ppt. I totally have not idea what has gone wrong.
/* Open a sample data table */
dt = Open( "C:\Users\Ann Ann/12.jmp" );

// Find the Y Columns
numericColNamesList = dt << get column names( string, numeric );

For( i = N Items( numericColNamesList ), i >= 1, i--,
	If(
		Not(
			Is Missing( Num( Word( 1, numericColNamesList[i], ":" ) ) ) == 0 &
			Word( 2, numericColNamesList[i], ":" ) != ""
		),
		numericColNamesList = Remove( numericColNamesList, i, 1 )
	)
);

// Run the Variance Charts
// With dynamic Y columns and fixed X columns
obj = Variability Chart( Y( Eval( numericColNamesList ) ), X( :LOT, :WAFER ) );


robj << Save Presentation( "C:\Users\Ann Ann\1.pptx" );
Open( "C:\Users\Ann Ann\1.pptx" );

/* Close table and all invisible reports */
Close( dt, No Save );


- Mark as New
- Bookmark
- Subscribe
- Mute
- Subscribe to RSS Feed
- Get Direct Link
- Report Inappropriate Content
Re: How to write a script to be able to plot any parameters based on the raw data ?
By default, the Save Presentation() function will write on top of any previous pptx created, unless you specify the "A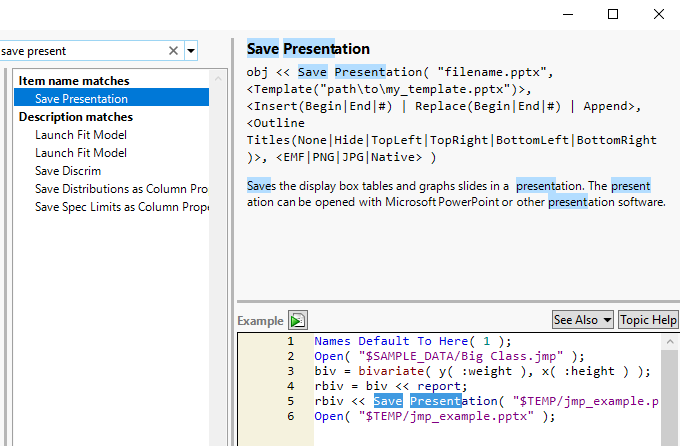
- Mark as New
- Bookmark
- Subscribe
- Mute
- Subscribe to RSS Feed
- Get Direct Link
- Report Inappropriate Content
Re: How to write a script to be able to plot any parameters based on the raw data ?
Thank you, Jim
- « Previous
-
- 1
- 2
- Next »
Recommended Articles
- © 2026 JMP Statistical Discovery LLC. All Rights Reserved.
- Terms of Use
- Privacy Statement
- Contact Us