- Don’t miss your chance to experience Discovery Summit Europe at our best available rate! Early bird registration through 31 Oct.
- Graph Builder Toolbar streamlines interactive graphing. Creates shortcuts on Report and GraphBuilder Helpers toolbars. Download and install the extension.
- Subscribe to RSS Feed
- Mark Topic as New
- Mark Topic as Read
- Float this Topic for Current User
- Bookmark
- Subscribe
- Mute
- Printer Friendly Page
Discussions
Solve problems, and share tips and tricks with other JMP users.- User Community
- :
- Discussions
- :
- Re: How to show the actual range in the level values in Graph Builder?

- Mark as New
- Bookmark
- Subscribe
- Mute
- Subscribe to RSS Feed
- Get Direct Link
- Report Inappropriate Content
How to show the actual range in the level values in Graph Builder?
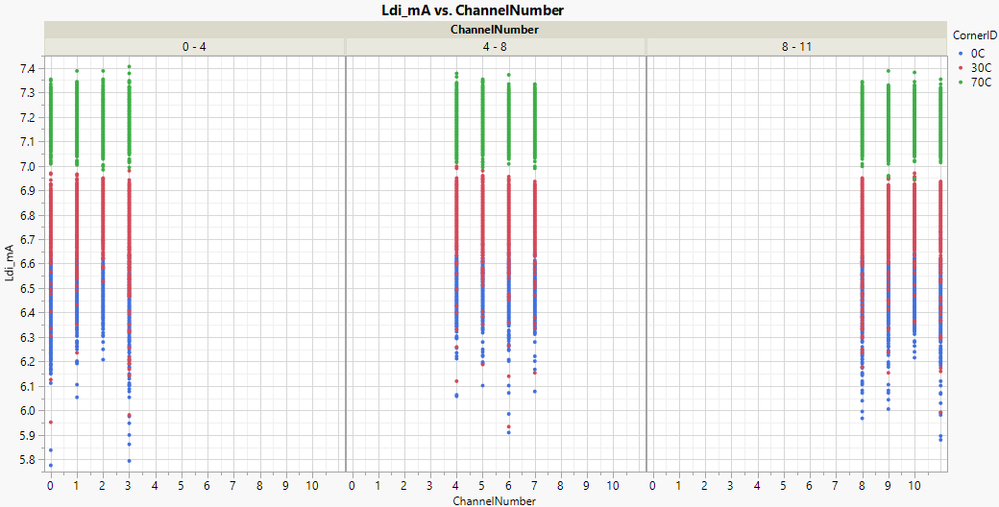
In the attached plot, the property of column "ChannelNumber" is Numeric/Continuous. I found it confusing in the grouped values at the top. "0-4" actually includes 0-3, as shown at the bottom; "4-8" actualy includes 4-7. It seems the range at the top always has overlapping values between adjacent levels. What can I do to make this overlap go away (i.e. I want it to show "0-3", "4-7","8-11" at the top)? Thank you very much...

- Mark as New
- Bookmark
- Subscribe
- Mute
- Subscribe to RSS Feed
- Get Direct Link
- Report Inappropriate Content
Re: How to show the actual range in the level values in Graph Builder?
What a wonderful feature: custom labels !
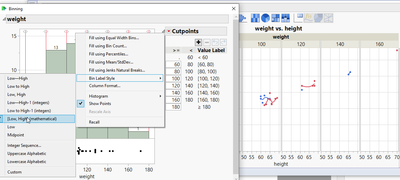
I tried to reproduce the steps in the screenshots with Jmp 17.1.0 - but once I change something in the binning scheme or the Bin Label Style, the displayed labels switch to "single number only" - independent of the Bin Label Style settings.
This is how it looks after pressing "OK" and opening the menu again:
- Mark as New
- Bookmark
- Subscribe
- Mute
- Subscribe to RSS Feed
- Get Direct Link
- Report Inappropriate Content
Re: How to show the actual range in the level values in Graph Builder?
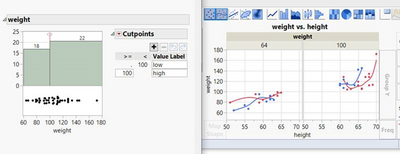
Jmp support confirmed that this is a known bug in Jmp 17.1 - th same if you try to use custom labels:
According to the settings on the left, it should be "low" and "high" but in the plot actually it is "64" and "100":
- Mark as New
- Bookmark
- Subscribe
- Mute
- Subscribe to RSS Feed
- Get Direct Link
- Report Inappropriate Content
Re: How to show the actual range in the level values in Graph Builder?
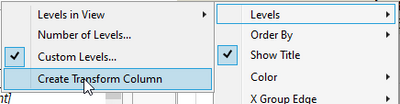
Workaround at the moment:
"save" the user define binning as a Transform Column and use that column.
the disadvantage: the user loses the ability to adjust the settings via Right Click/ Custom Labels ...
- Mark as New
- Bookmark
- Subscribe
- Mute
- Subscribe to RSS Feed
- Get Direct Link
- Report Inappropriate Content
Re: How to show the actual range in the level values in Graph Builder?
Seems to be fixed in Jmp 17.2
thanks :)
- « Previous
-
- 1
- 2
- Next »
Recommended Articles
- © 2026 JMP Statistical Discovery LLC. All Rights Reserved.
- Terms of Use
- Privacy Statement
- Contact Us