Turn on suggestions
Auto-suggest helps you quickly narrow down your search results by suggesting possible matches as you type.
- Don’t miss your chance to experience Discovery Summit Europe at our best available rate! Early bird registration through 31 Oct.
- Graph Builder Toolbar streamlines interactive graphing. Creates shortcuts on Report and GraphBuilder Helpers toolbars. Download and install the extension.
Options
- Subscribe to RSS Feed
- Mark Topic as New
- Mark Topic as Read
- Float this Topic for Current User
- Bookmark
- Subscribe
- Mute
- Printer Friendly Page
Discussions
Solve problems, and share tips and tricks with other JMP users.- User Community
- :
- Discussions
- :
- How to separate box plot groups with a straight line?

Level IV
- Mark as New
- Bookmark
- Subscribe
- Mute
- Subscribe to RSS Feed
- Get Direct Link
- Report Inappropriate Content
How to separate box plot groups with a straight line?
Created:
Apr 25, 2020 12:32 PM
| Last Modified: Apr 25, 2020 9:37 AM
(3520 views)
Hello Everybody,
I manage to align data points to corresponding box plots but depending on data there can be more boxes in one group. For interpretation purposes I would like to draw additional lines on the plot that will visually separate each "F" group, like in the right hand picture attached. I would appreciate for hints how to do that. Best regards.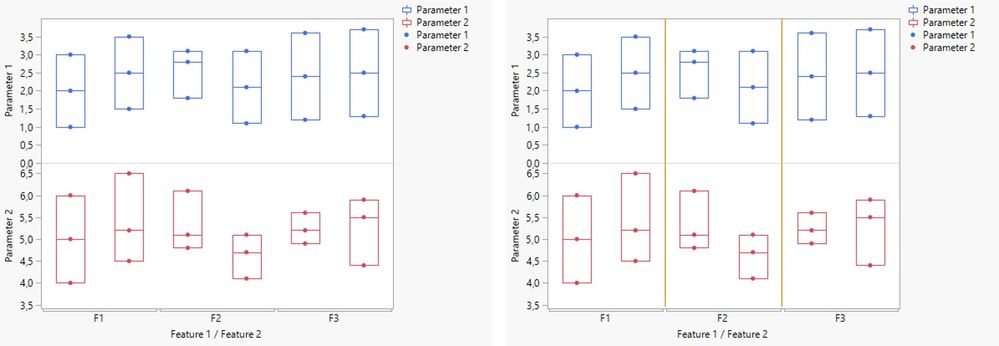
1 ACCEPTED SOLUTION
Accepted Solutions


Super User
Solution
- Mark as New
- Bookmark
- Subscribe
- Mute
- Subscribe to RSS Feed
- Get Direct Link
- Report Inappropriate Content
Re: How to separate box plot groups with a straight line?
Not sure this is what you want, but if you use Graph Builder and drag the Parameters to the Y axis and Feature 1 to the Group X option and feature 2 to the X axis
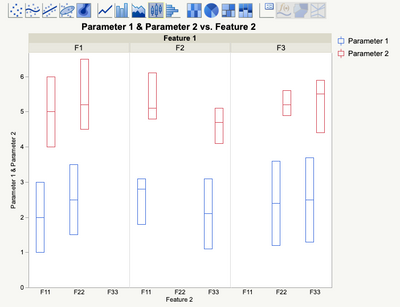
you will get the separate areas
"All models are wrong, some are useful" G.E.P. Box
2 REPLIES 2
Super User
Solution
- Mark as New
- Bookmark
- Subscribe
- Mute
- Subscribe to RSS Feed
- Get Direct Link
- Report Inappropriate Content
Re: How to separate box plot groups with a straight line?
Not sure this is what you want, but if you use Graph Builder and drag the Parameters to the Y axis and Feature 1 to the Group X option and feature 2 to the X axis
you will get the separate areas
"All models are wrong, some are useful" G.E.P. Box
Level IV
- Mark as New
- Bookmark
- Subscribe
- Mute
- Subscribe to RSS Feed
- Get Direct Link
- Report Inappropriate Content
Re: How to separate box plot groups with a straight line?
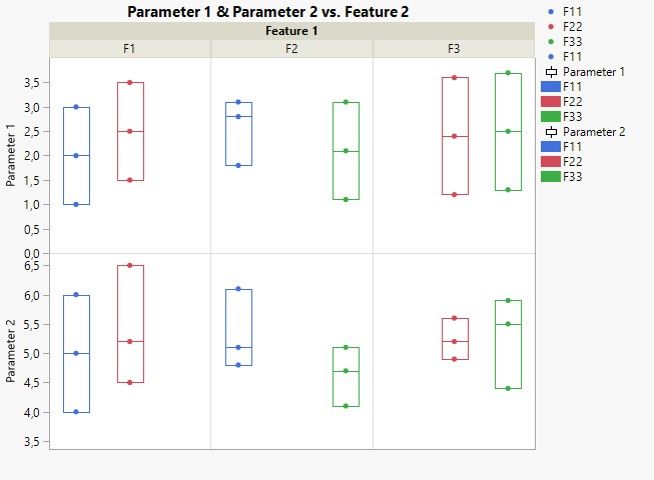
Hello statman, thank you for your reply, that looks good and I will use that method. However I thought that the main groups F1, F2 and F3 can be displayed in the X axis but now it doesn't matter. I put Feature 2 as color to make differences between subgroups. Redundant legends can be removed. Thank you once again.
Recommended Articles
- © 2026 JMP Statistical Discovery LLC. All Rights Reserved.
- Terms of Use
- Privacy Statement
- Contact Us